 Cape Epic · arrivée · Nick Muzik
The science
e-FORT is not a pretty layer over raw data. Its value rests on validated physiological models — and on a discipline about their limits.
What runs underneath every screen.
Four models, four published papers, four sets of parameters recalibrated on your own history. Here is each of them, with the equation that runs and what it changes for you.
Model · critical power and W′
P(t) = CP + W′ / t
τ = 546 · e−0,01·DCP + 316
Monod & Scherrer 1965 · Skiba 2012
Above critical power you draw on a finite reserve, measured in kilojoules. Below it, the reserve rebuilds — slowly, and at a rate that depends on how far below you are riding. e-FORT recomputes it every second of every ride, and it is what predicts the moment you run out.
The reserve is stored in joules, not in percent. Two athletes at 20 % left do not have the same amount left to rebuild — and a percentage hides exactly that.
Model · impulse and response
Forme(j) = Forme(j−1) · e−1/42 + charge(j)
Fatigue(j) = Fatigue(j−1) · e−1/7 + charge(j)
Équilibre = Forme − Fatigue
Banister 1975 · Calvert et al.
Every session deposits a load into two counters that decay exponentially — one slow, one fast. Your shape today is the gap between them. And beyond a certain fatigue threshold, your effective capacity drops in a predictable way, which the model applies before you feel it.
Peak form is not the day you train the most. It arrives once fatigue has fallen and fitness has not yet decayed — a window the model can place weeks in advance.
Model · morning recalibration
base = moyenne( ln rMSSD , 7 j )
z = ( ln rMSSD − base ) / σ
capacité du jour = capacitéBanister · f(z)
Plews et al. 2013 · Buchheit 2014
A variability two standard deviations below your own baseline signals central nervous system fatigue that load models alone never capture. The capacity projected by Banister is corrected accordingly — before you get on the bike, and before the session goes wrong.
One bad night changes nothing. The rolling average decides — day-to-day variability is far too noisy to steer anything on its own.
Model · quantified race craft
η = Σ Eutile / Σ Edépensée
classement A · B · C · D par impulsion
e-FORT · proprietary, cross-referenced with the terrain profile
e-FORT isolates each impulse above threshold, measures the speed gain in the seconds that follow, and confronts it with the gradient. What comes out is an efficiency index and a share of energy spent for nothing — a reading elite coaches used to do by hand, on a handful of races a year.
It is the only one of the four that improves without touching your physiology. On a 90-minute cross-country race, removing 15 % of the useless impulses is worth about 45 seconds.
These models calibrate on your own history. The more e-FORT accumulates, the more precise the projections become — which is why the platform gets more useful the longer you use it.
A published model is only the shape of an equation.
The equations above are public. Anyone can implement them. What makes them right — or wrong by a factor of six — are the parameters, and those are individual.
Extracted from your best-power curve across your whole history — not from a laboratory test you have never taken, and not from a fixed percentage of your threshold.
Several competing formulations of that time constant coexist in the literature — Skiba’s, calibrated on trained cyclists, Bartram’s, revised for elite riders. They do not return the same value. e-FORT applies the one that matches your profile.
The same watts do not cost the same on a technical cross-country circuit and on smooth tarmac. A terrain multiplier applies to the time constant, because the recovery you actually get between two efforts is not the same one.
This is where an implementation is judged. A platform that applies one single time constant to everybody is not wrong on the equation — it is wrong on the athlete.
The strategy does not come out of a language model.
Model · mechanics of forward motion
P = ( ½ρ · CdA · v³ + Crr · m · g · v · cosθ
+ m · g · v · sinθ + m · a · v ) / η
Classical mechanics · no estimation, no learned coefficient
For a given course, the optimiser searches for the power distribution that minimises total time without ever emptying your reserve before the line — under the constraint of your capacity today. Aerodynamics, rolling, gravity, inertia. The equation is closed and it is old.
Which is also what makes a strategy reproducible: same inputs, same output, every time. A language model does not guarantee that.
Your equipment has things to say.
SRAM is collaborating with e-FORT to enrich the application for its Hammerhead Karoo bike computer. Suspension, drivetrain and cadence, cross-referenced with the terrain and with your physiology — for the benefit of the rider, not of a datasheet.
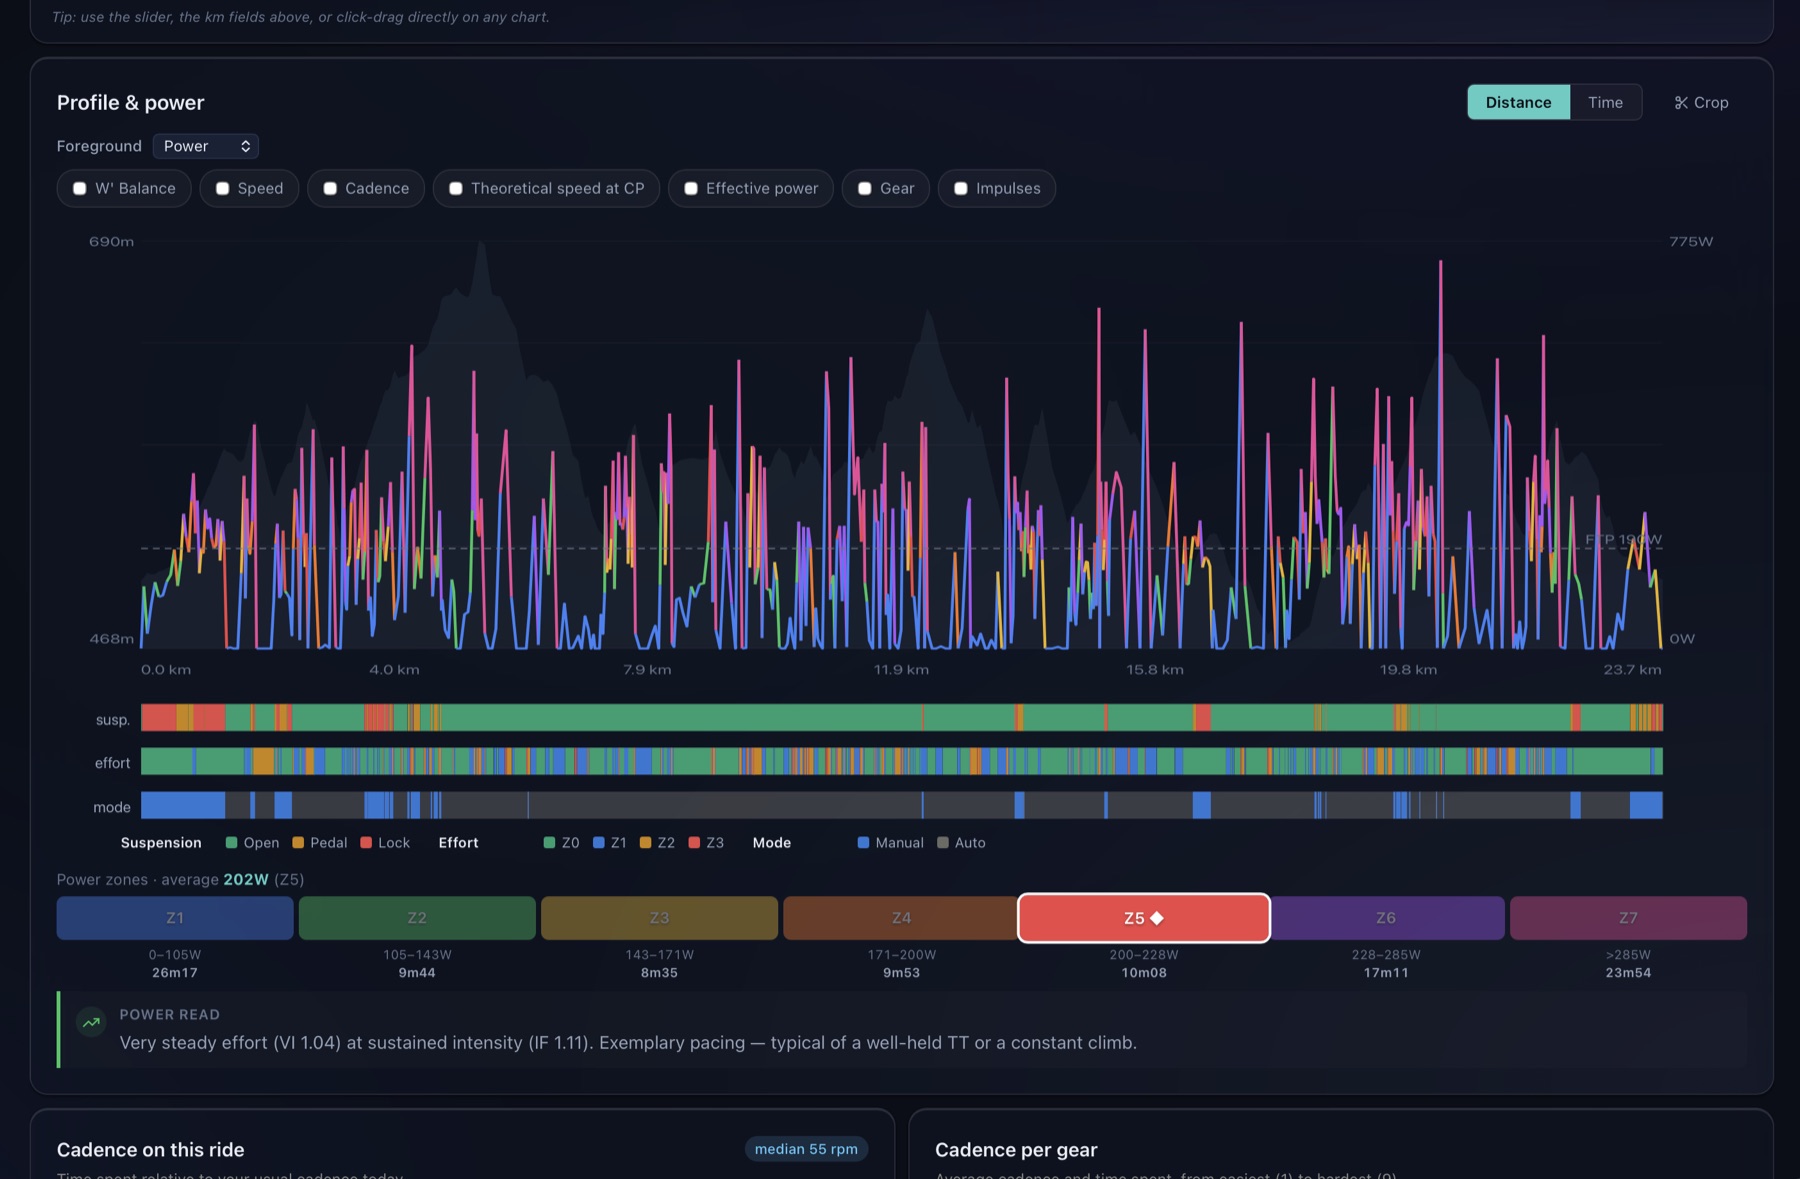
Gear selection, suspension state and terrain, synchronised along the same course. You see where you were in the wrong gear, where the suspension was locked out when it shouldn’t have been, and how that lines up with what your legs were doing.
What we rest on, by name.
None of what runs underneath e-FORT was invented for the occasion. Each model comes from published research, and here is which one.
Monod & Scherrer, 1965
The hyperbolic relationship between power and time to exhaustion, from which critical power and the finite reserve above it are derived.
Banister et al., 1975
The impulse-response model: one load, two counters with different time constants, and a projected performance read as the gap between them.
Coggan & Allen, 2006
Normalised power, intensity factor and load score — today the common language of power-based training, and free for everyone in e-FORT.
Skiba et al., 2012
How the anaerobic reserve rebuilds during intermittent effort, and the time constant that depends on how far below critical power you are recovering.
Plews et al., 2013 · Buchheit, 2014
The practical use of morning heart-rate variability in trained athletes: rolling baseline, individual dispersion, and the daily noise that must be ignored.
Bartram et al., 2018
A revised time constant for elite cyclists, whose profile departs from the population the original formula was fitted on — which is why e-FORT does not apply a single one to everybody.
The literature is the easy part. What is hard is running these four models on the same athlete, on the same second, with parameters that agree with one another — and saying so when they do not.
What is measured is presented as measured.
Suspension travel is not transmitted by the equipment. So e-FORT never puts a figure on watts or seconds lost to the suspension. We could. It would sell well. It would also be invented — and an invented number contaminates every real one next to it.
It is a useful approximation, calibrated on you. e-FORT says what it projects and what it observes — and never mixes the two on the same screen.
It maps what you say into physics. Deterministic code turns that physics into watts. The number always comes from the equation, never from the language model.
You can export everything, and delete everything. A team’s data is never cross-referenced with another’s, in any processing.
