The product
Connect your account once. Your whole history is analysed in seconds. Then e-FORT reads the context, assesses the intent, explains — and shows the way forward.
Your data already holds the answer. It just never spoke.
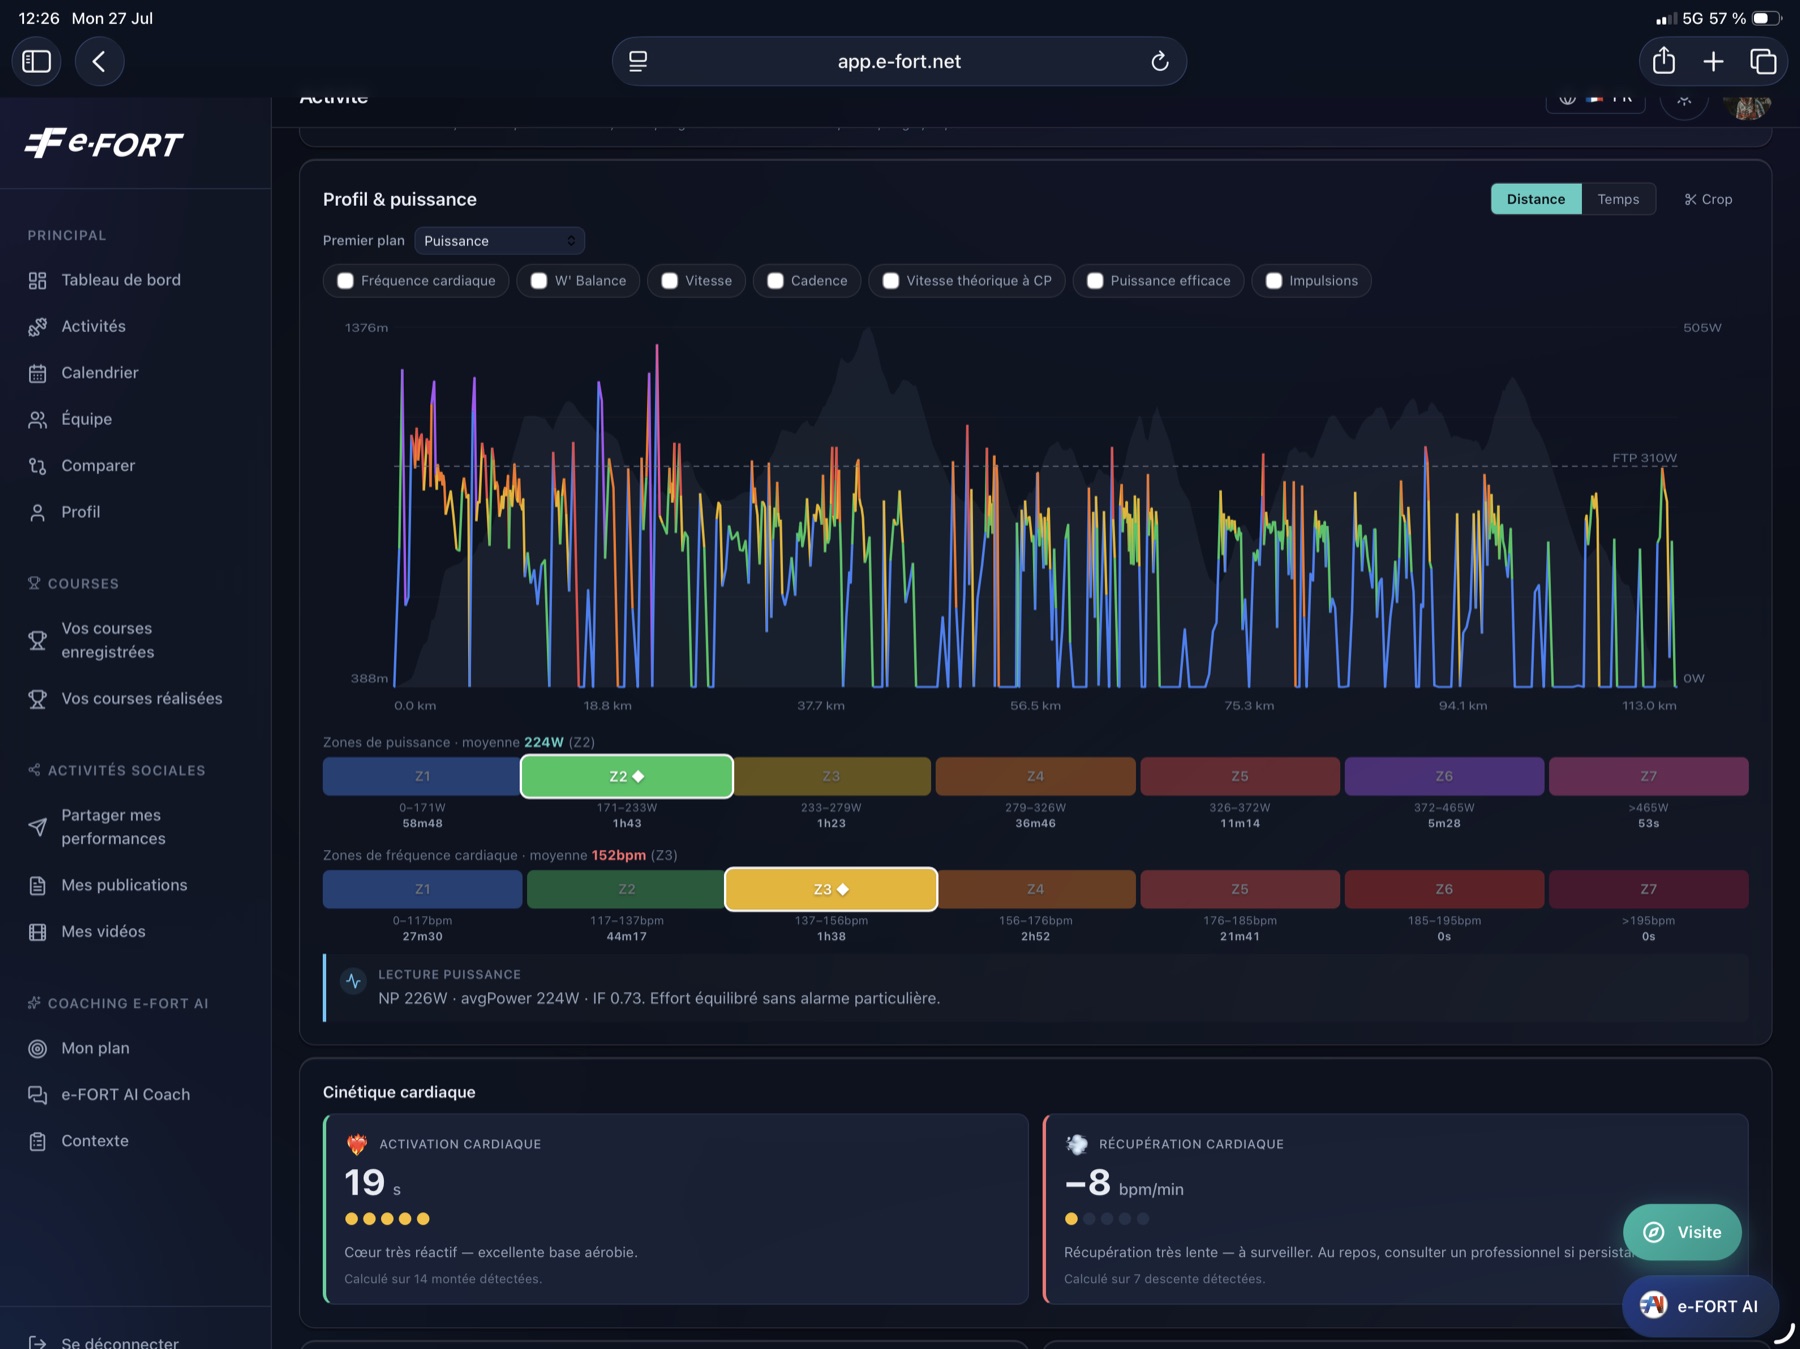
A climb, a sprint, thirty seconds or three hours: select it and every metric recalculates instantly. No predefined segments, no imposed routes. Anywhere in the world, on any terrain.
Normalised power, relative intensity and load score are free, for everyone. Your data doesn’t have to be earned.
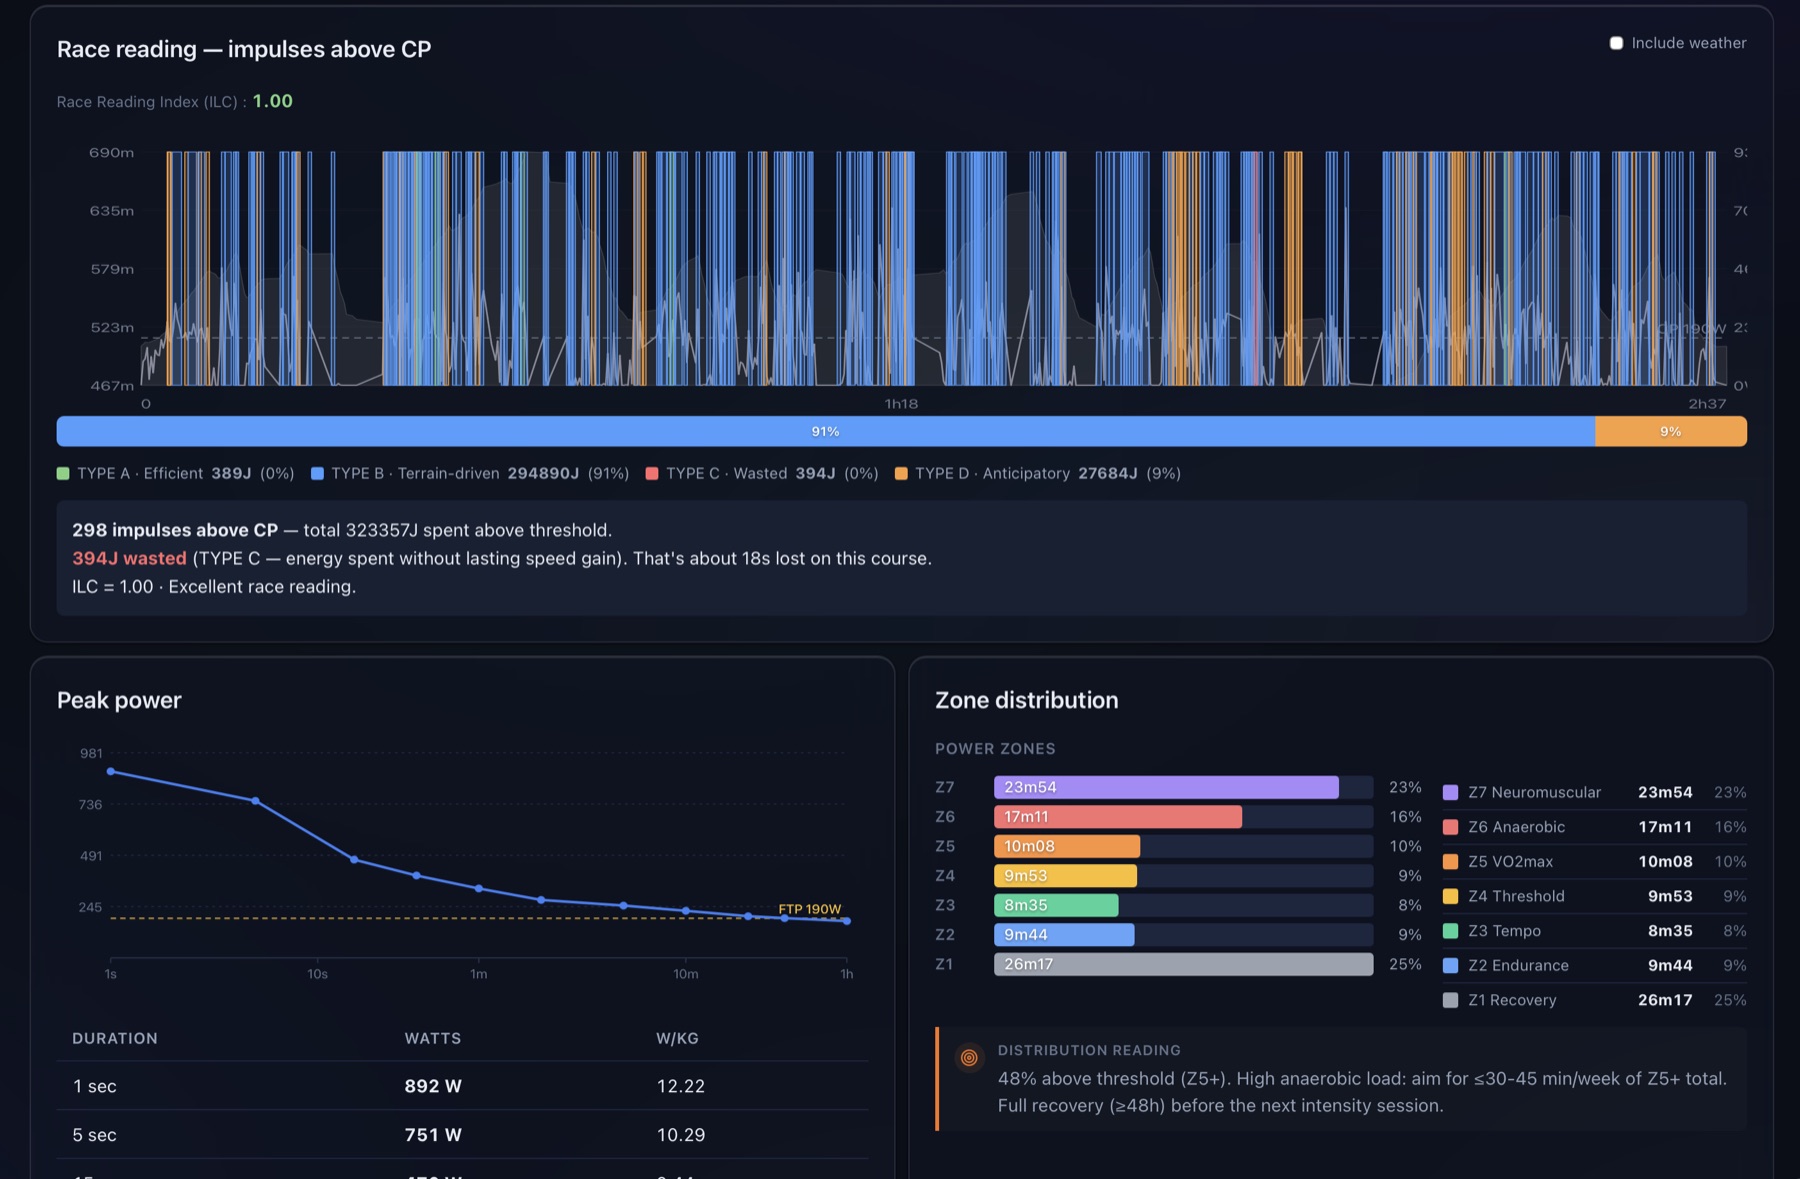
e-FORT classifies every effort above threshold and cross-references it with the terrain. An effective effort produces a lasting speed gain. A wasted one is followed by a speed loss with no reason in the ground beneath you.
This is race craft, quantified — and it improves without touching your capacity.
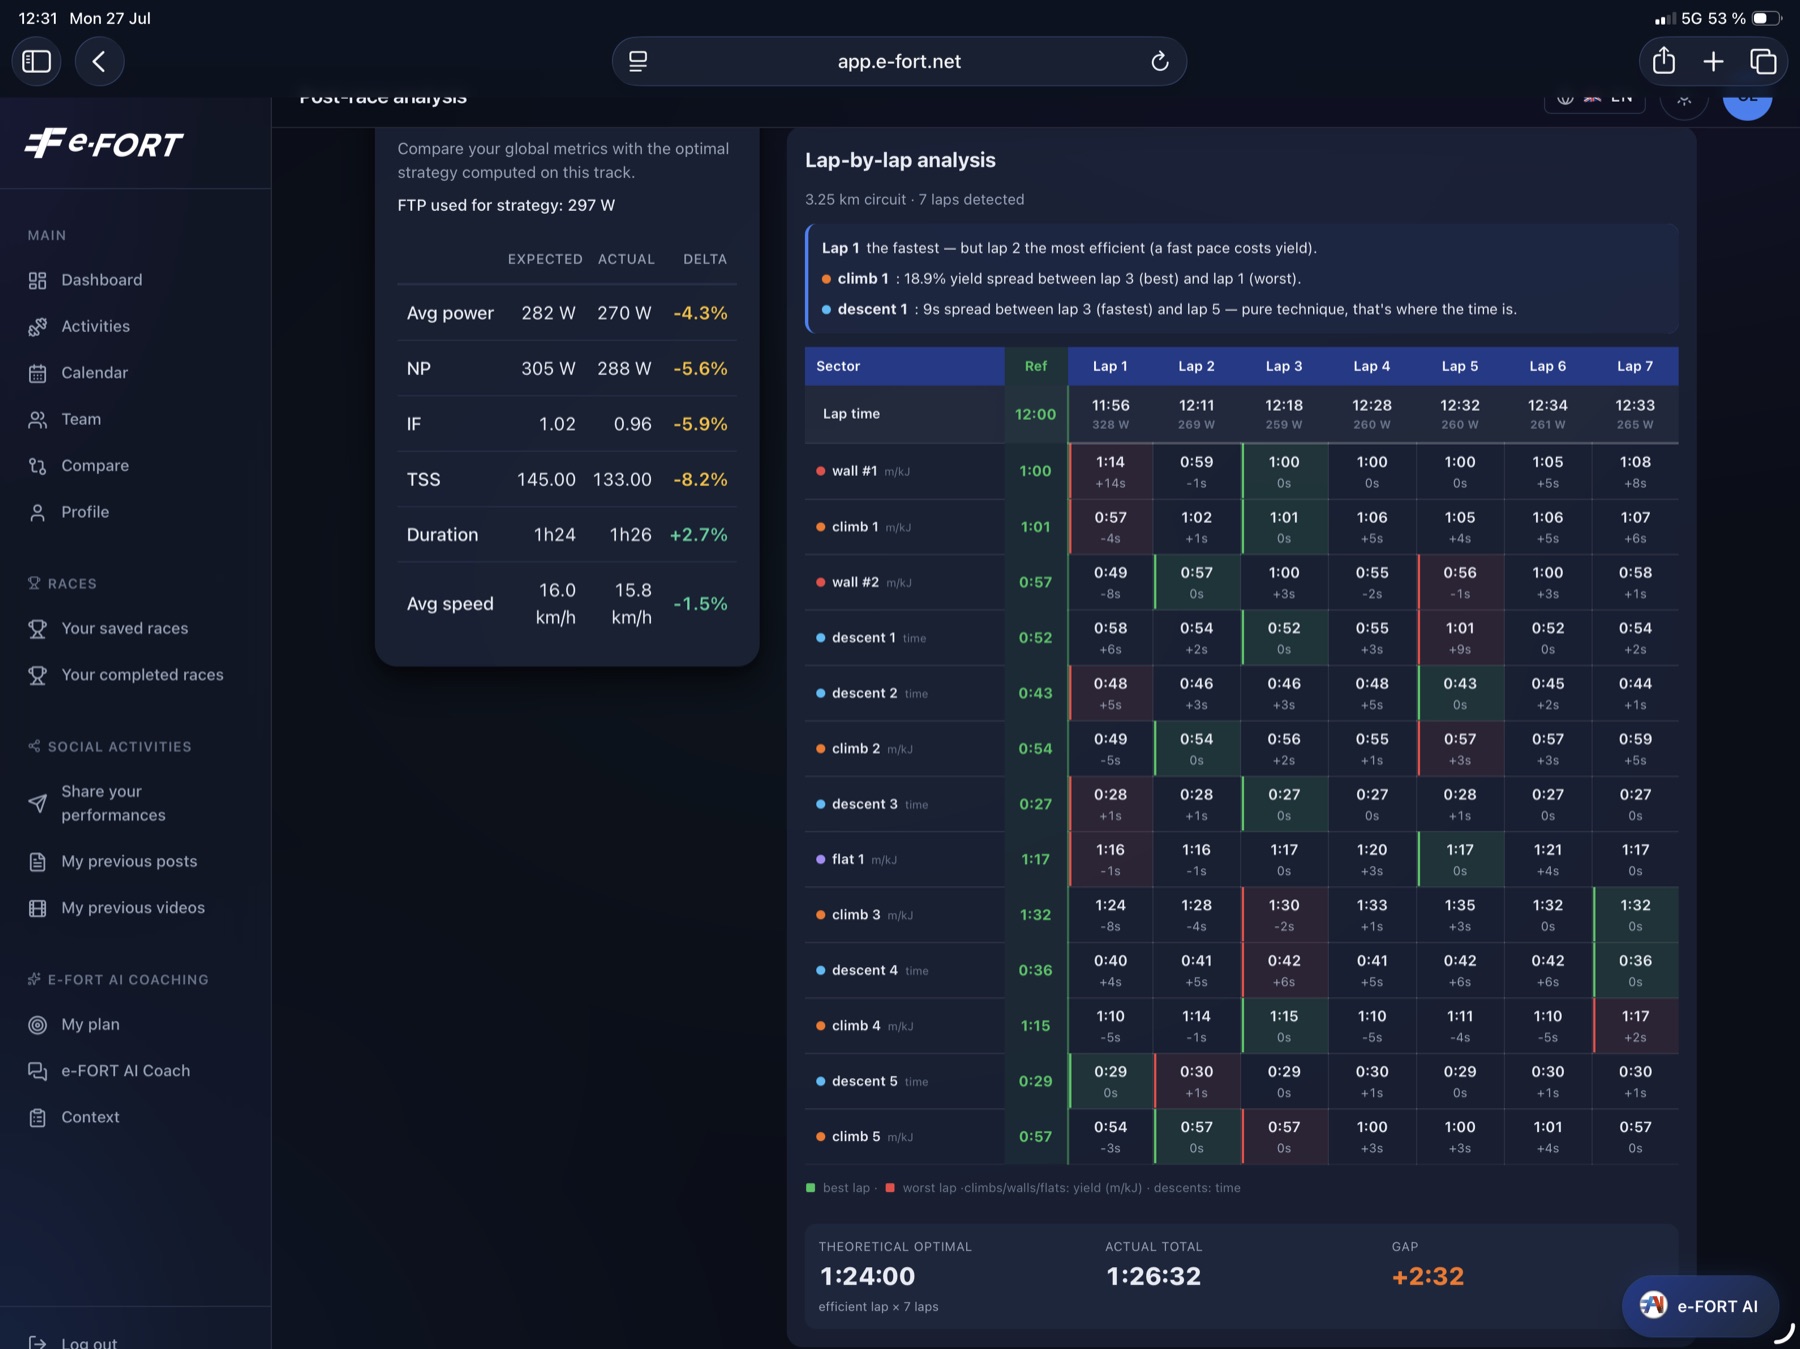
Automatic lap detection, sector-by-sector analysis, and the theoretical optimal lap — not your fastest lap, but the best compromise across every sector. A different AI briefing for each lap, and a 3D course model synchronised with the curves.
Sub-section · in collaboration with SRAM
Your drivetrain and your suspension record what they did. Nobody ever told you what it cost you. e-FORT reads those channels, lines them up with the terrain and with your physiology, and turns them into decisions.
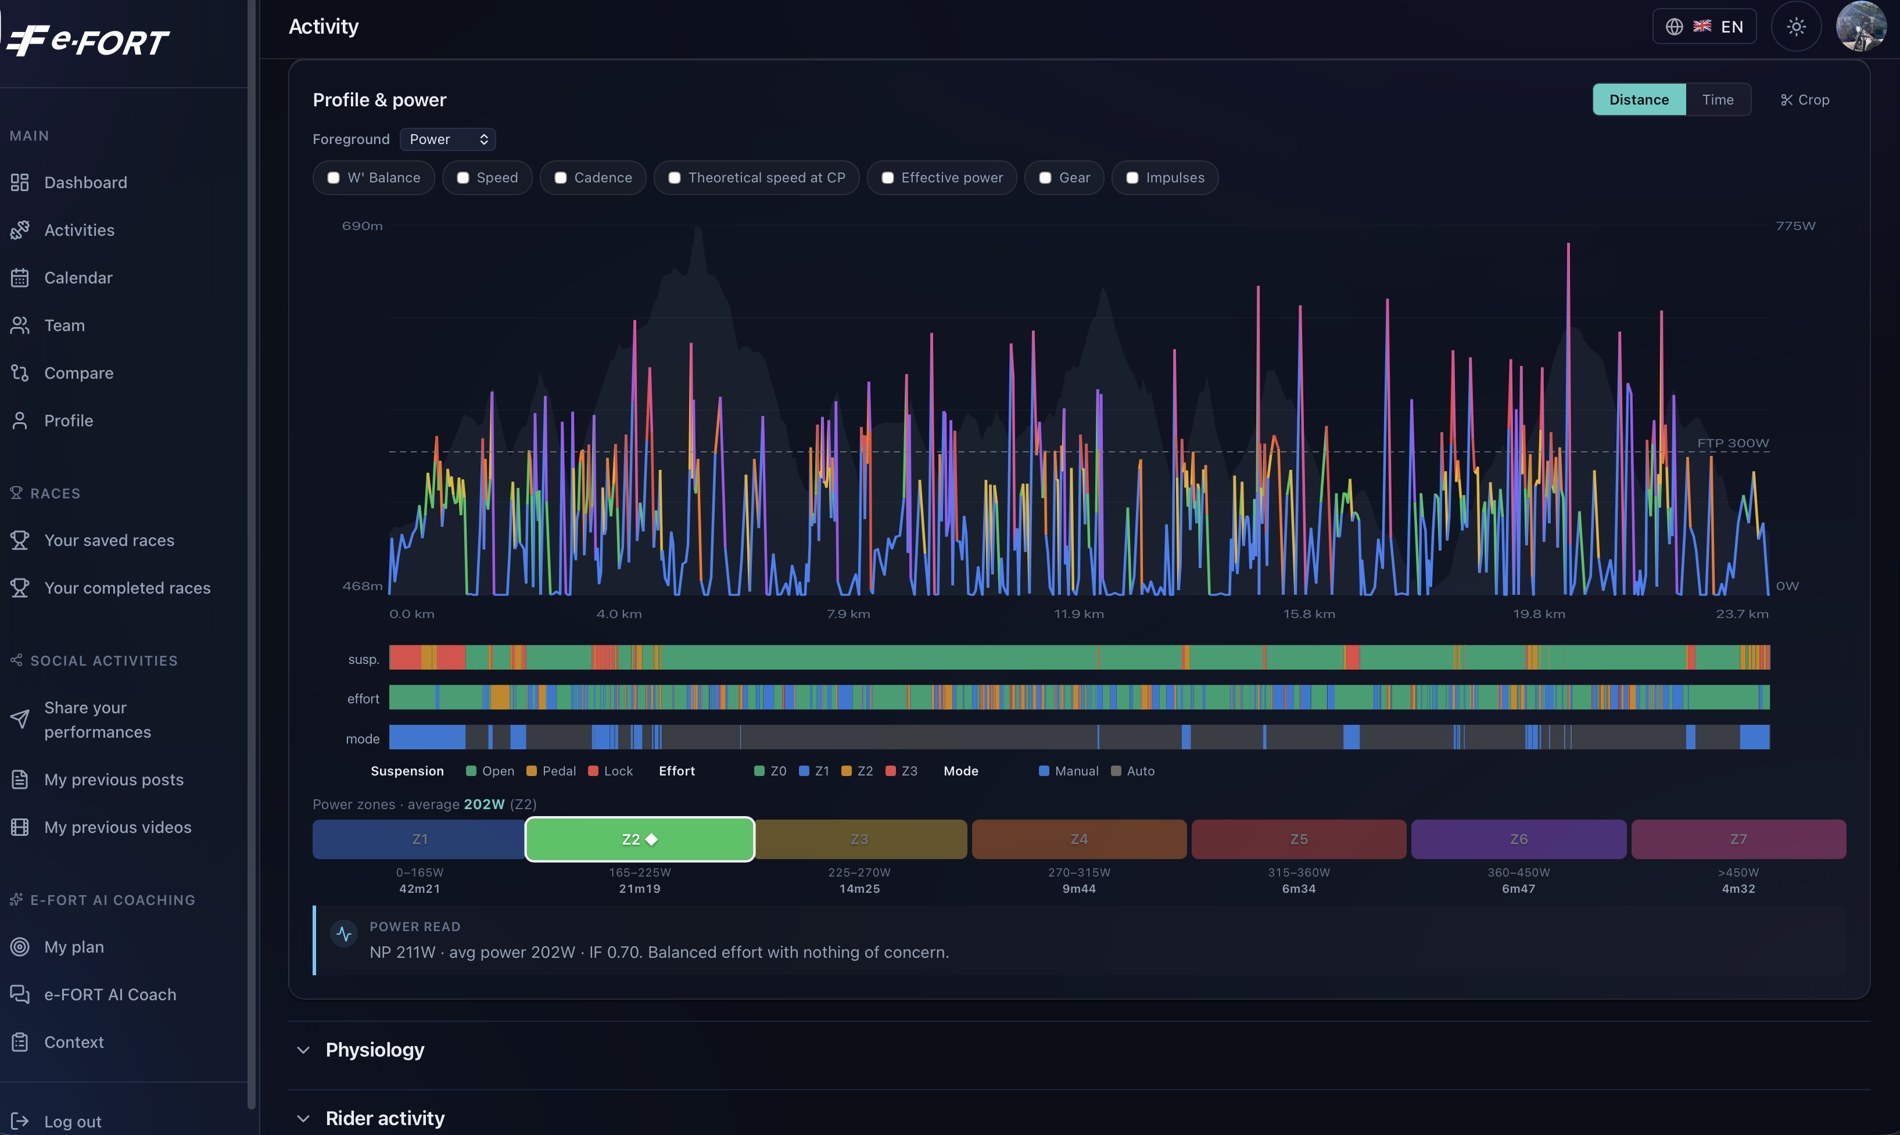
Under the power curve, three continuous tracks: the suspension position — open, pedal, lock — the effort zone, and whether the fork was in manual or automatic mode. Read together, they tell you what your equipment was doing at the exact moment your legs were doing something else.
Gear, cadence and theoretical speed at critical power are overlays you switch on and off — the same second, seen from another angle.
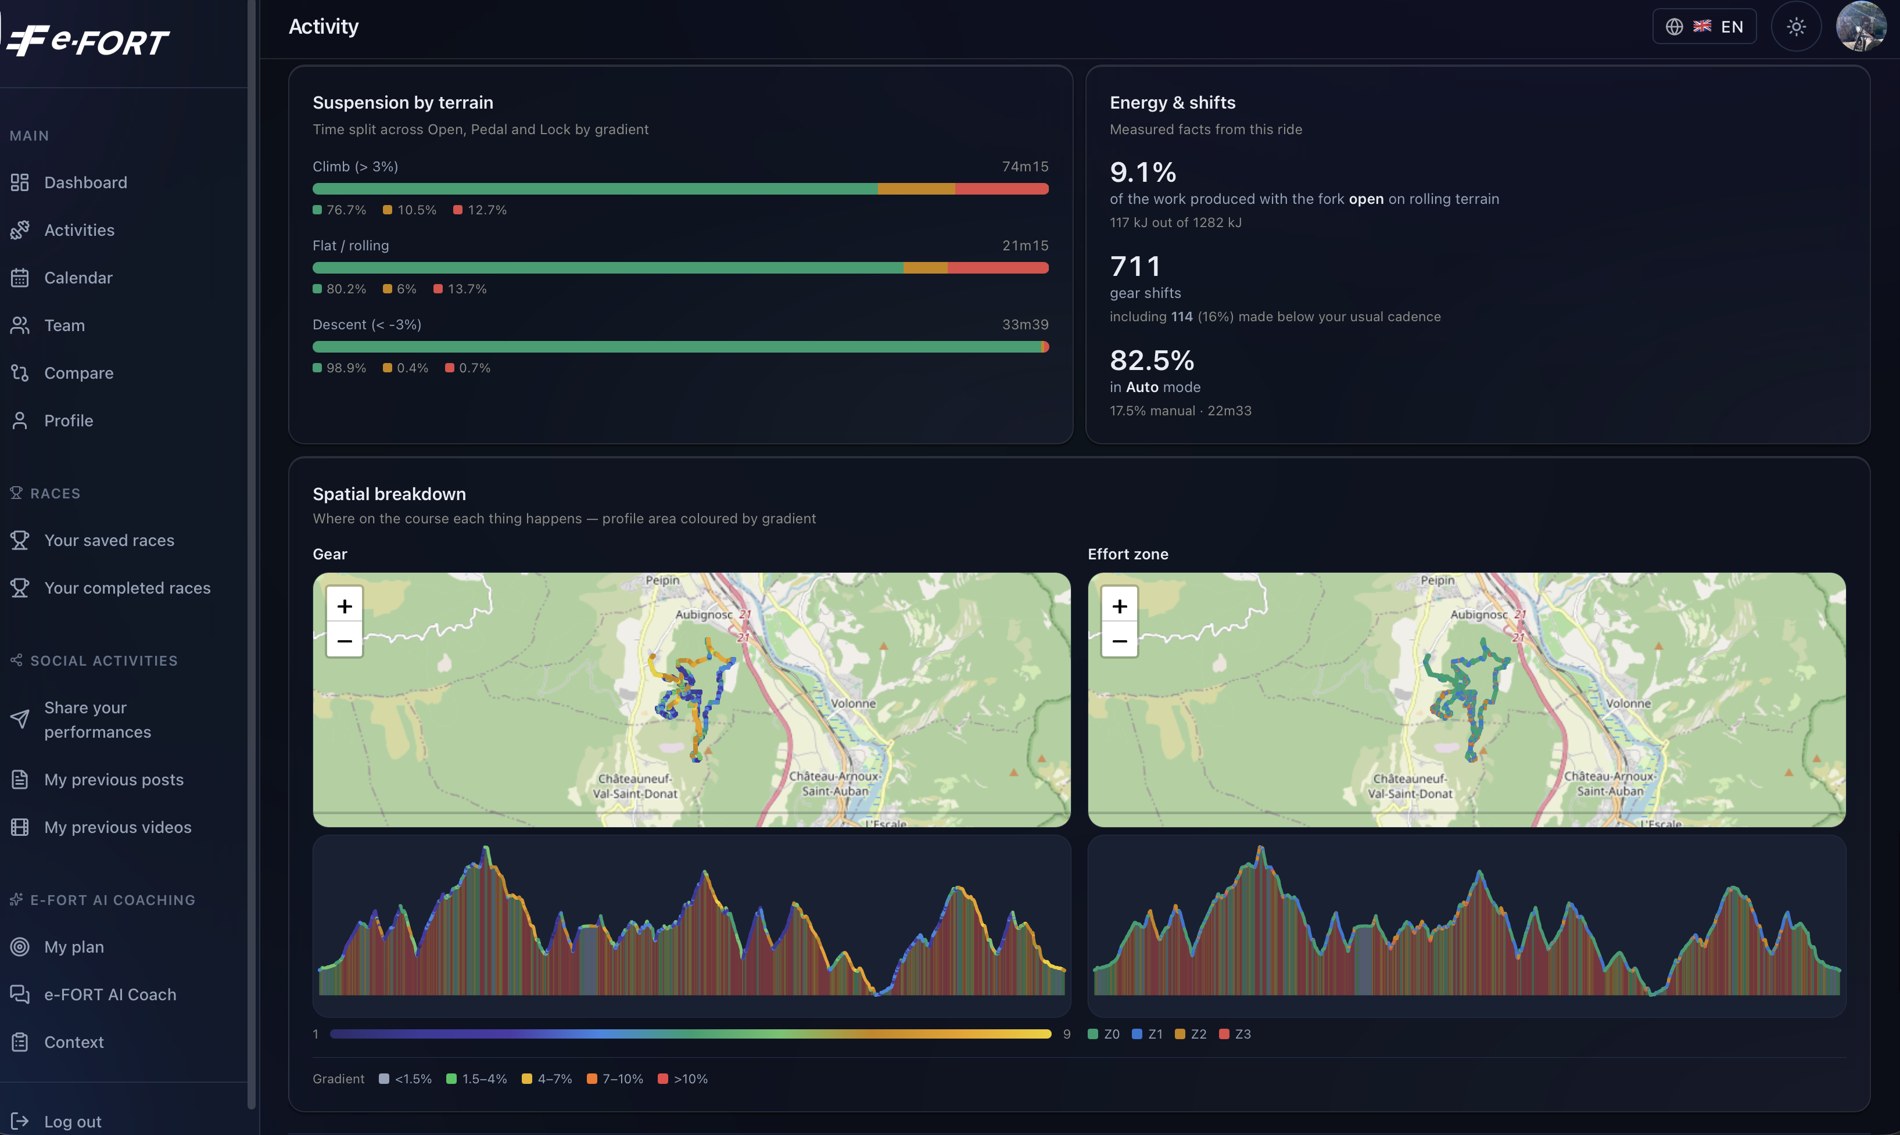
The time split across open, pedal and lock, by gradient. The number of shifts, and how many of them were made below your usual cadence. And the share of your work produced with the fork open on rolling terrain — the position that transmits worst.
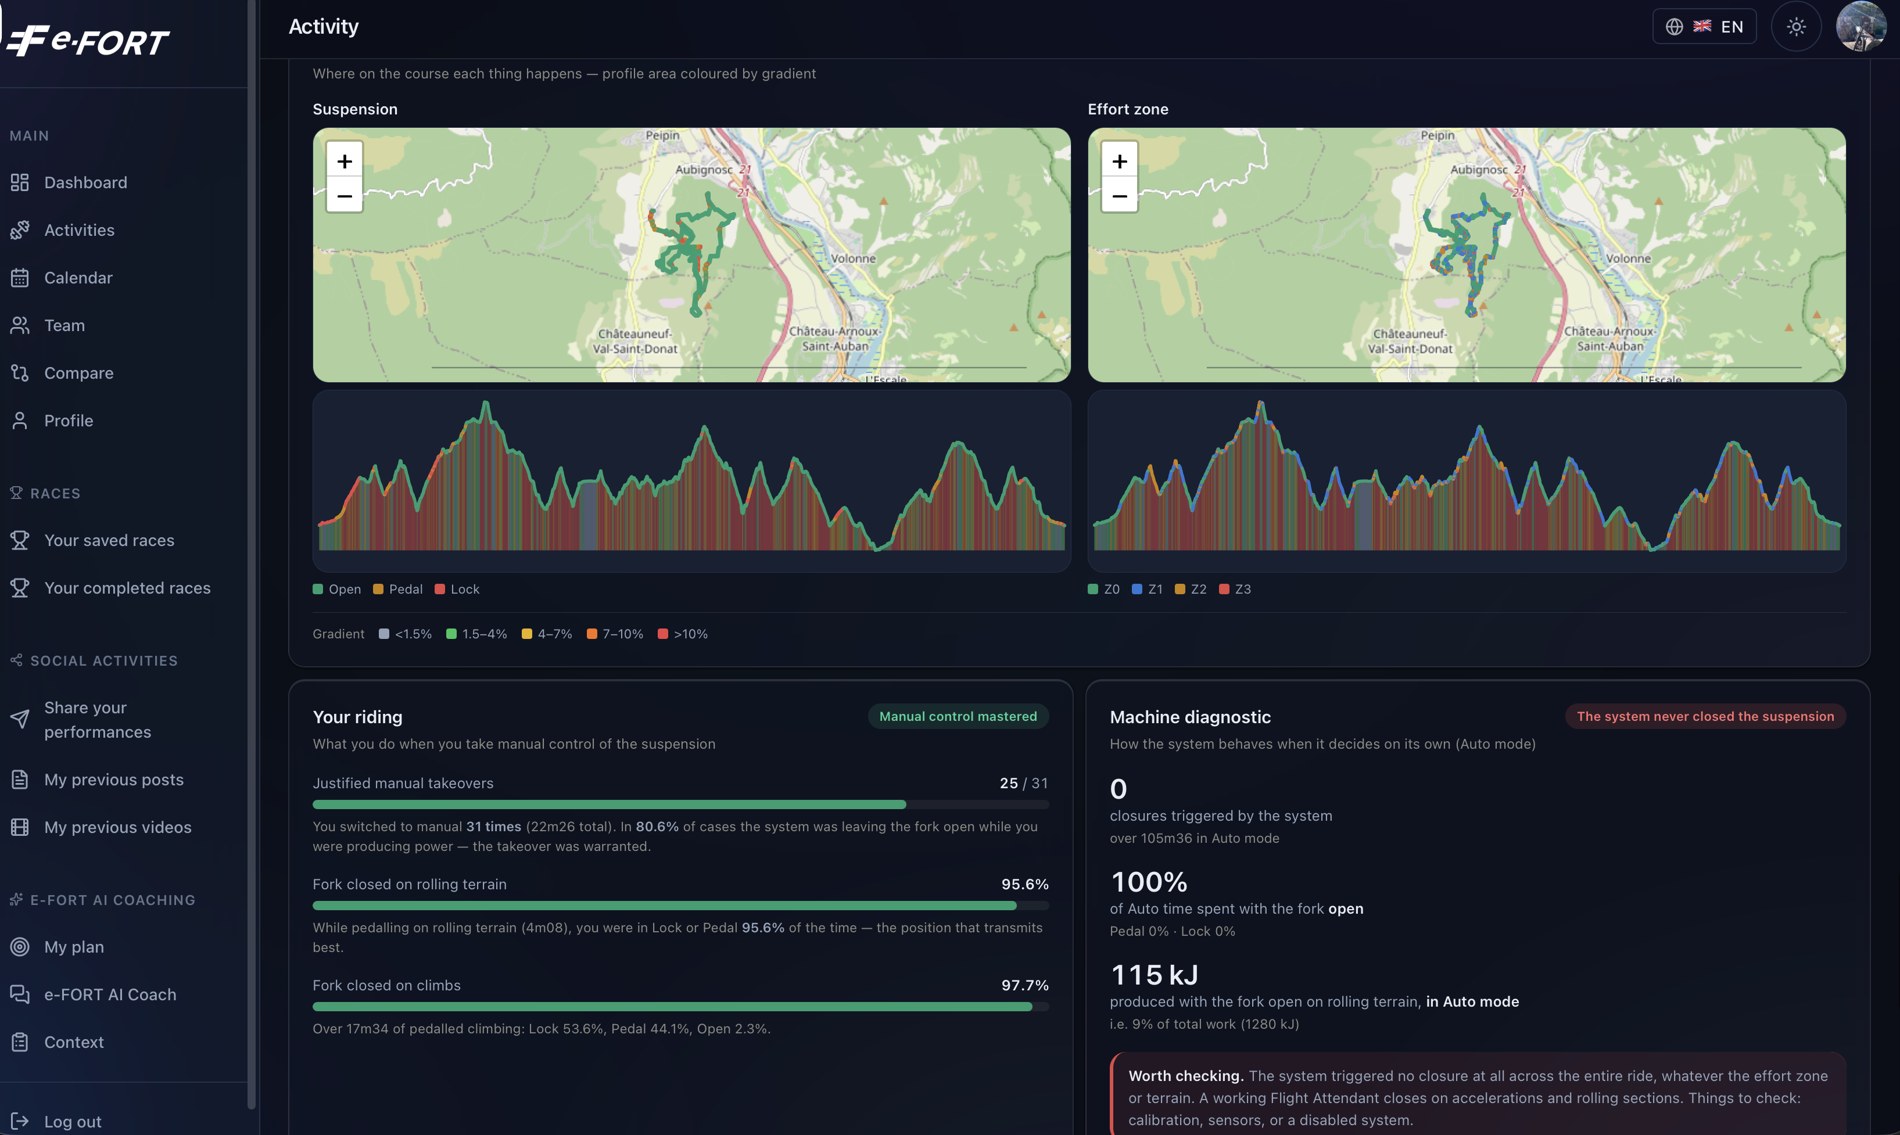
Two columns side by side: what you do when you take manual control, and what the system does when it decides on its own. On this ride, 25 of 31 manual takeovers were warranted — and the automatic mode triggered not a single closure in 105 minutes.
A working system closes on accelerations and rolling sections. Zero closures across an entire ride is a calibration, a sensor or a disabled system — and e-FORT says so rather than blaming your legs.
Included from Freemium. Full analysis of every session, with no card and no time limit.
See pricingCreate your own segment, and compare.
The averages of a five-hour ride drown whatever happened over ten kilometres. Bound the portion that matters and the whole analysis — indicators, zones, the AI verdict — is redone on that portion alone.
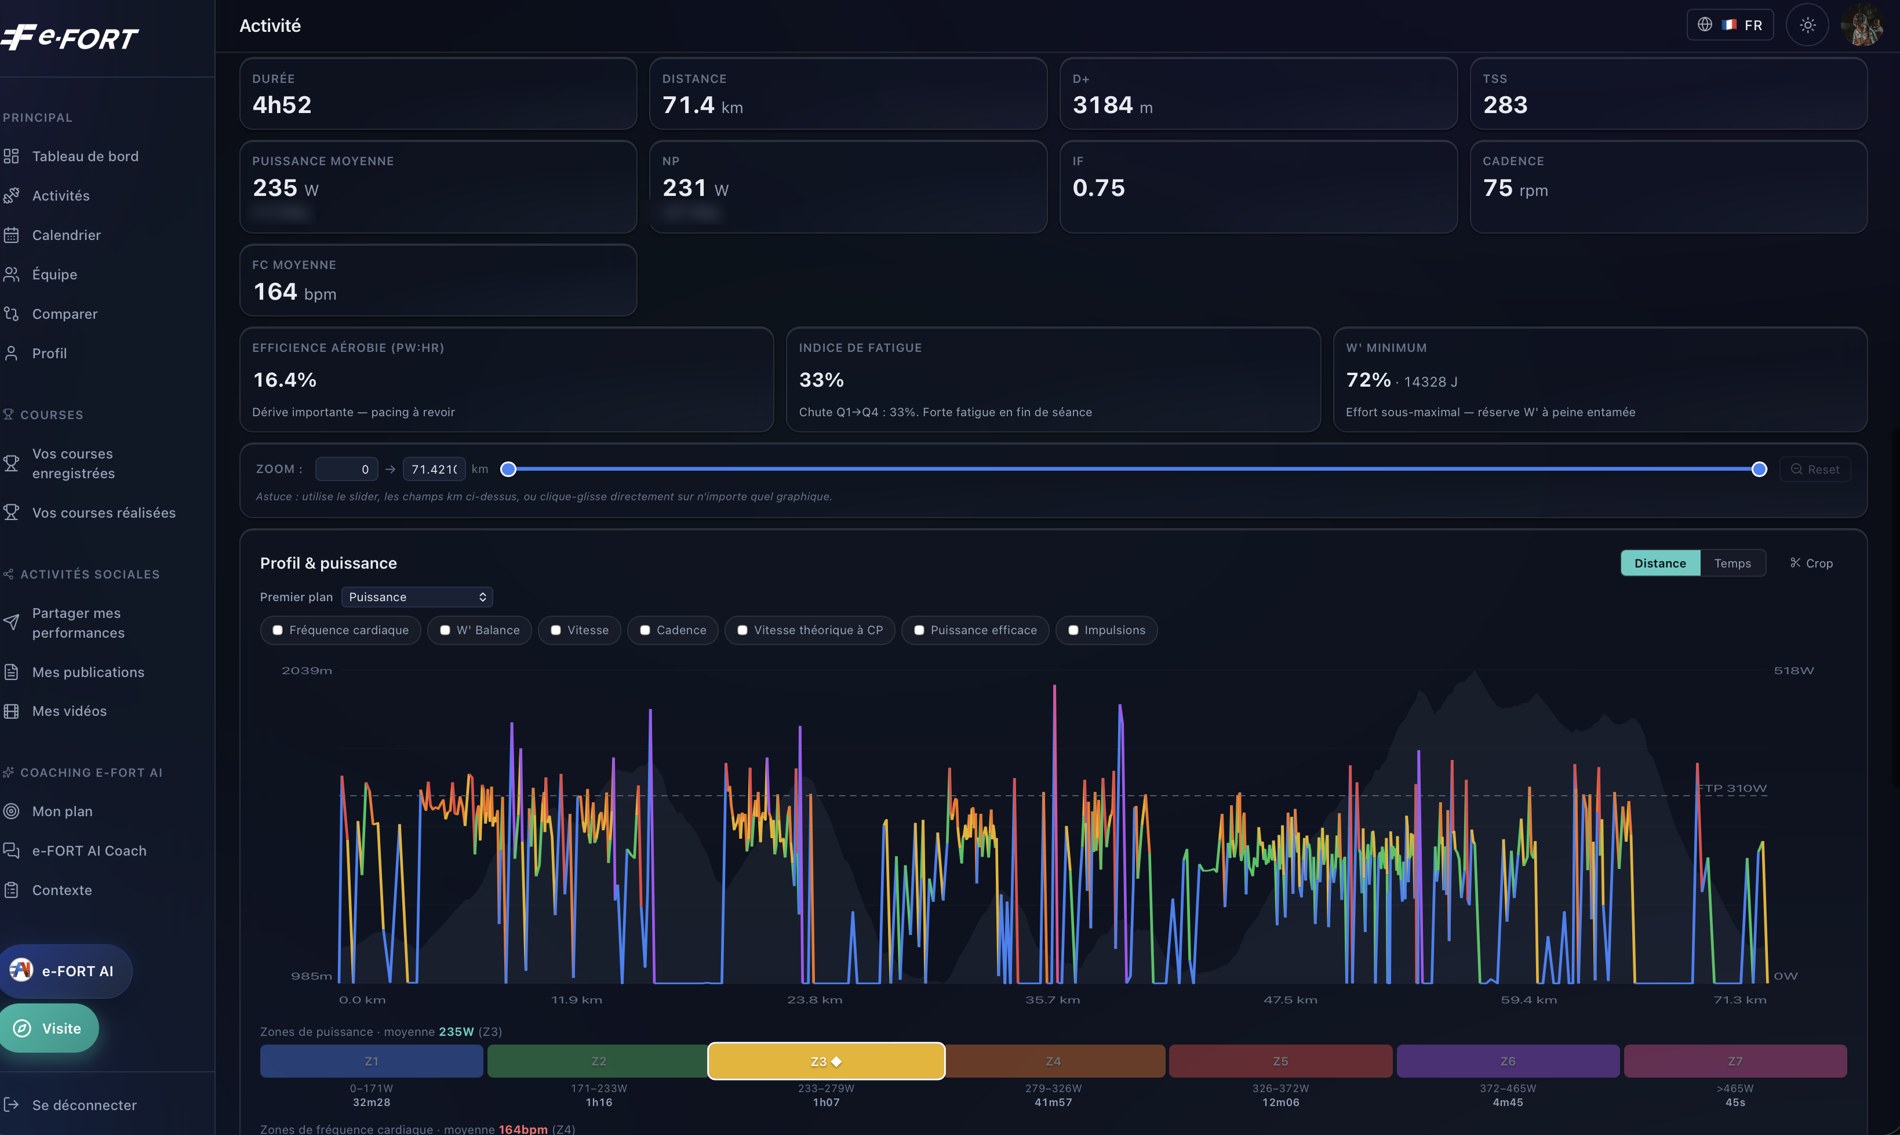
Duration, distance, climbing, load, normalised power, intensity, cadence, heart rate — and three readings the other tools do not give: aerobic efficiency, the fatigue index, and the lowest point your anaerobic reserve reached during the session.
Each indicator is commented, not merely displayed: 16.4 % drift, pacing to review — and a 33 % fall from the first quarter to the last.
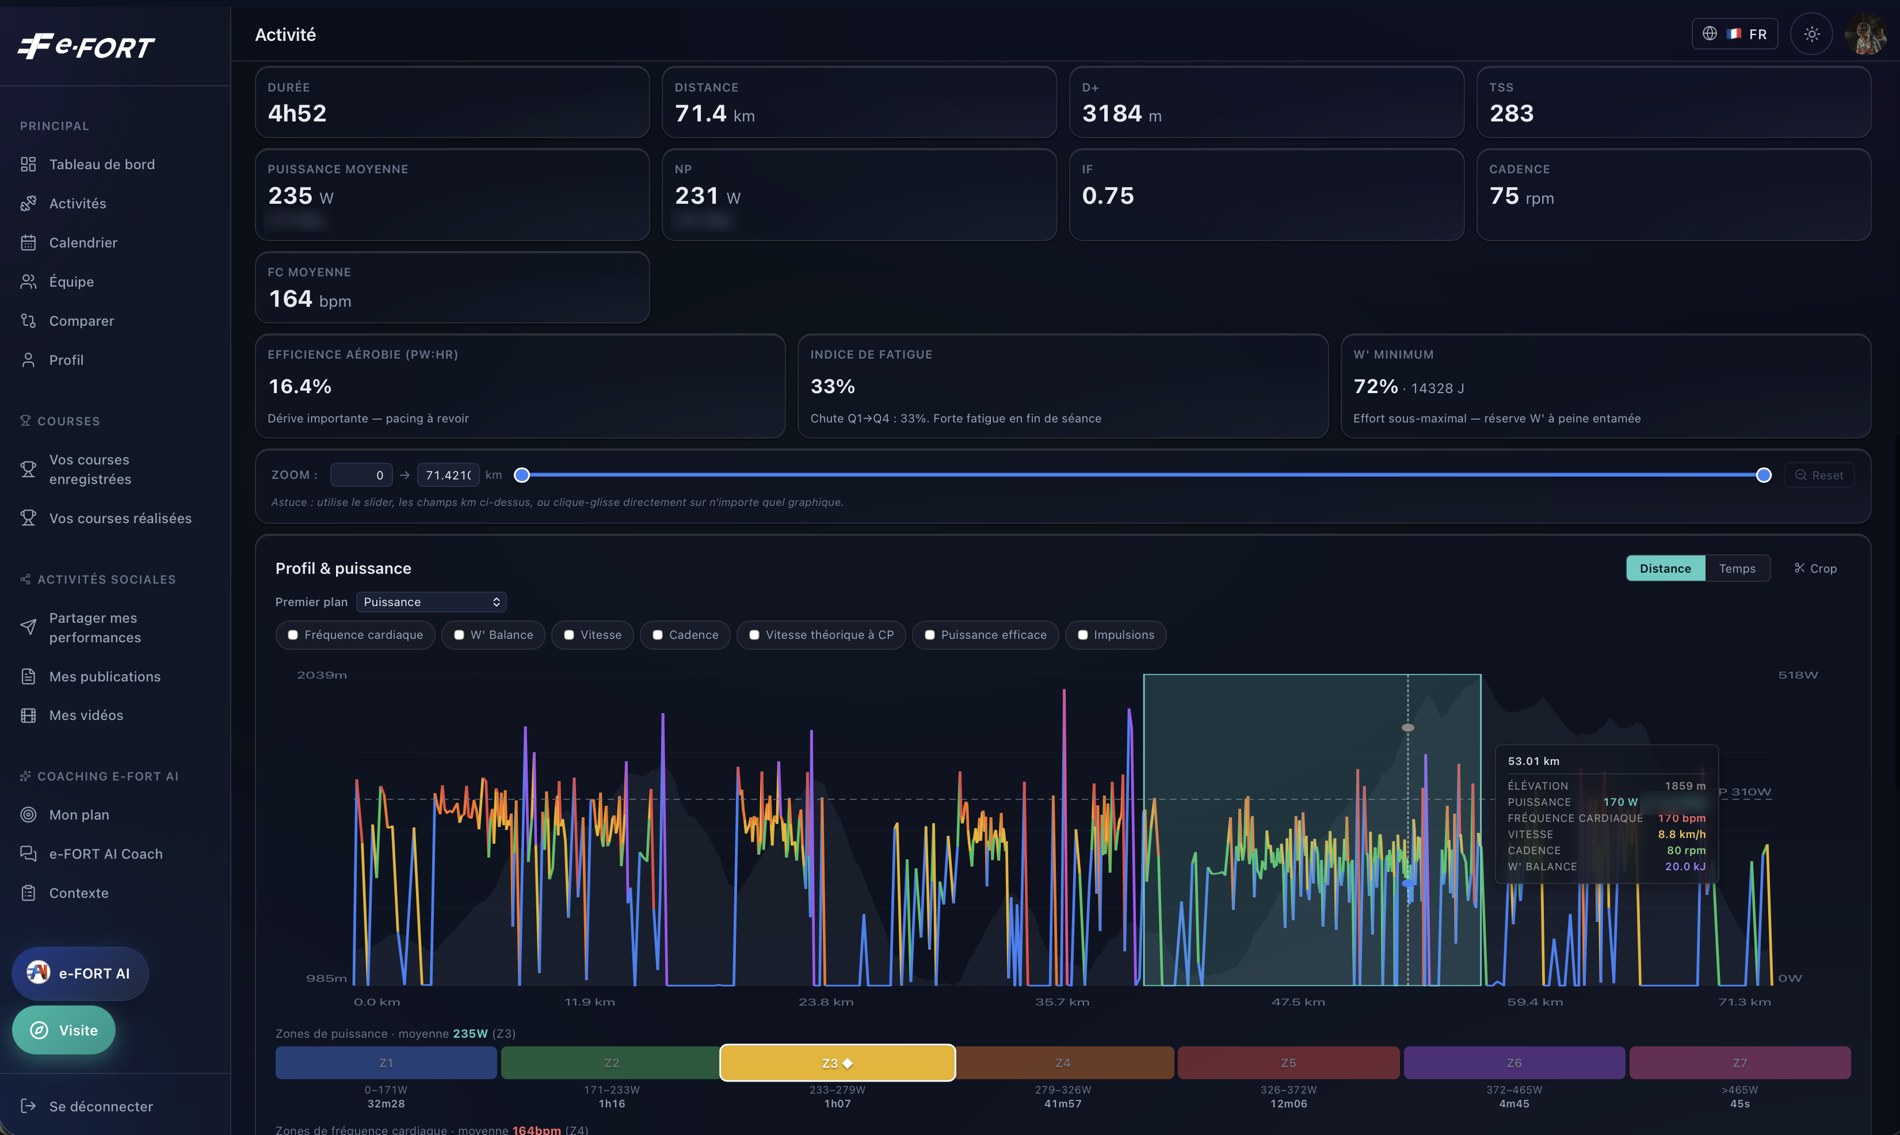
The slider, the kilometre bounds, or a simple click and drag across the chart: the selection is made on the fly, over the portion of your choosing. One climb, one attack, thirty seconds or three hours. Nothing is predefined, and no route is imposed.
And hovering gives the exact instant — 1,859 m of altitude, 170 bpm, 8.8 km/h, 80 rpm, 20 kJ of reserve left.
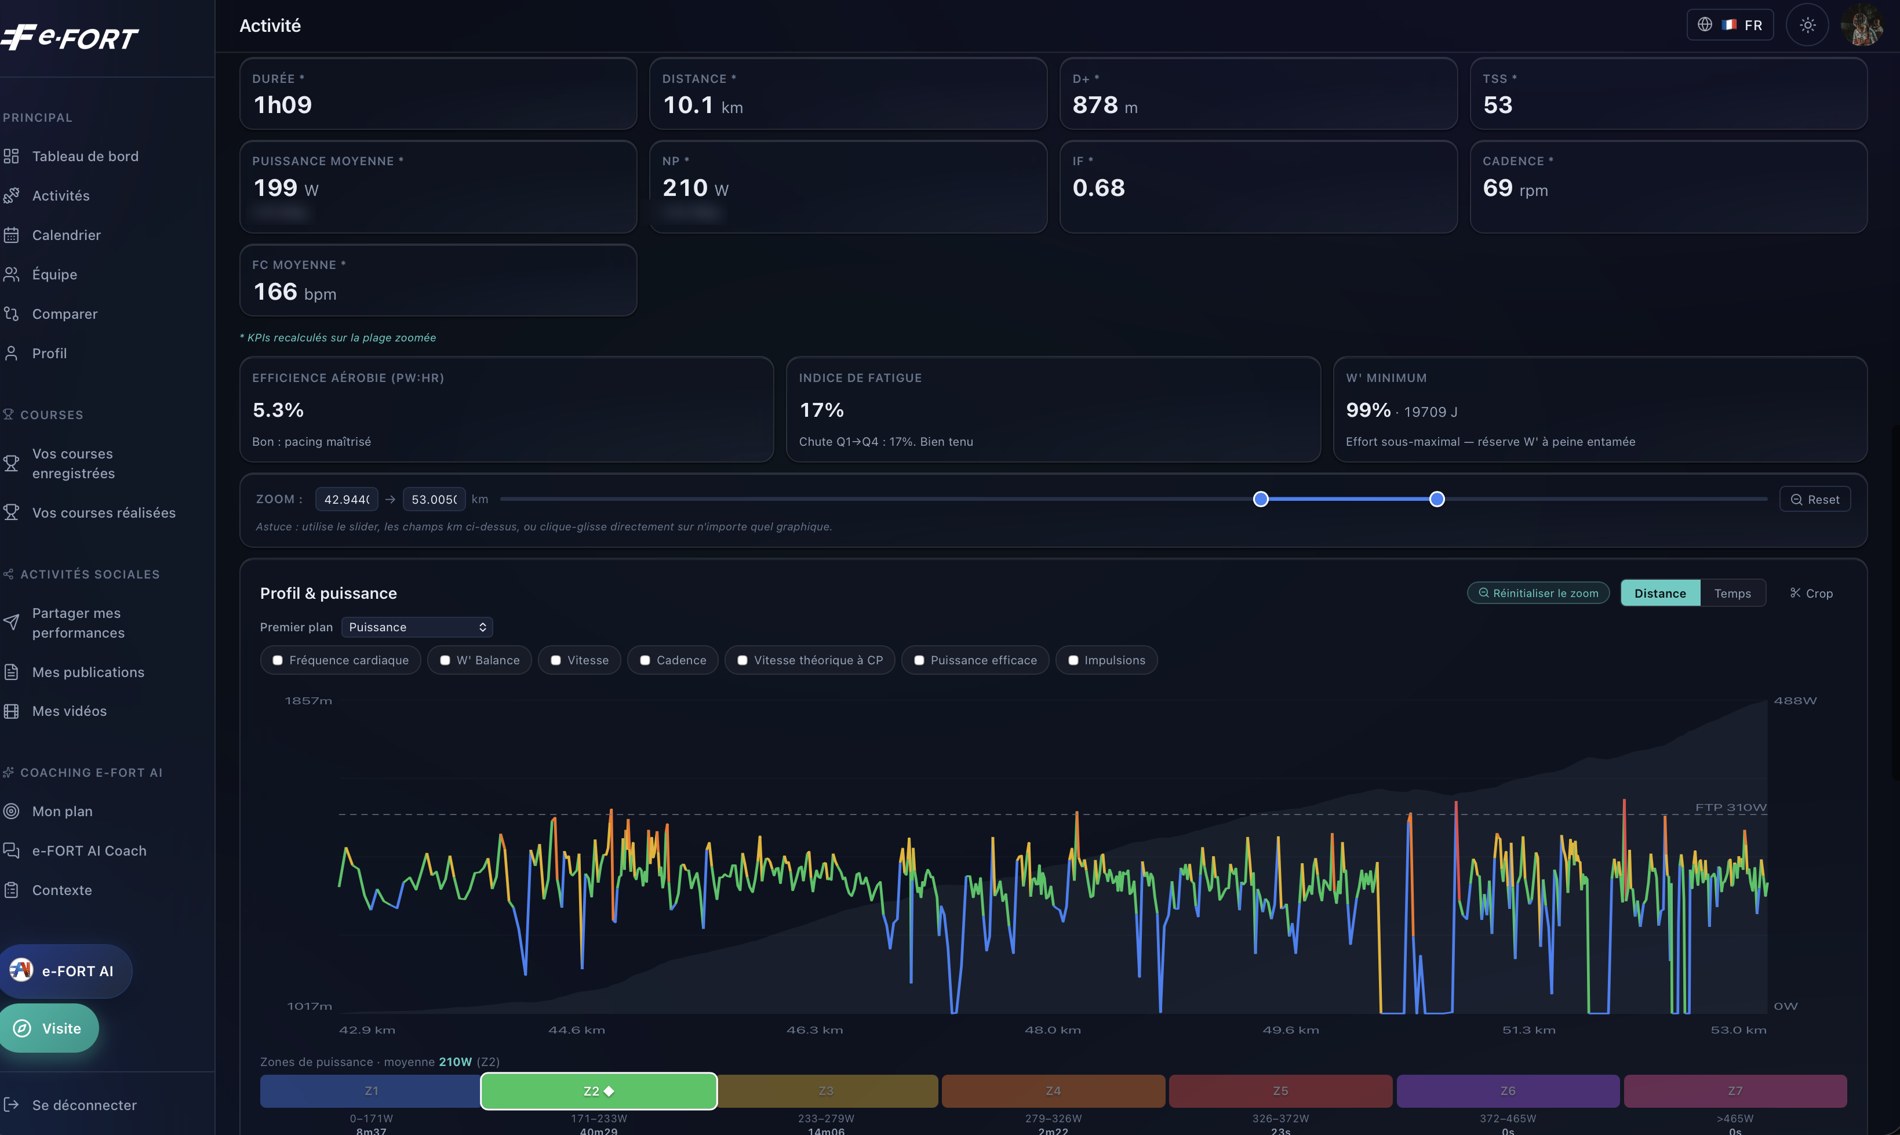
Ten kilometres kept out of seventy-one, and nothing holds on to the values of the whole ride: duration, climbing, load, normalised power, intensity, cadence, time in each zone — every indicator is recalculated over the selection alone, and flagged as such.
The e-FORT AI reading follows: drift falls from 16.4 % to 5.3 %, the fall from first quarter to last from 33 % to 17 %. The session was badly managed. That climb was not.
Once the portion is defined, e-FORT searches the entire history — yours, or your team’s — for the times it has already been ridden, and puts the two efforts side by side.
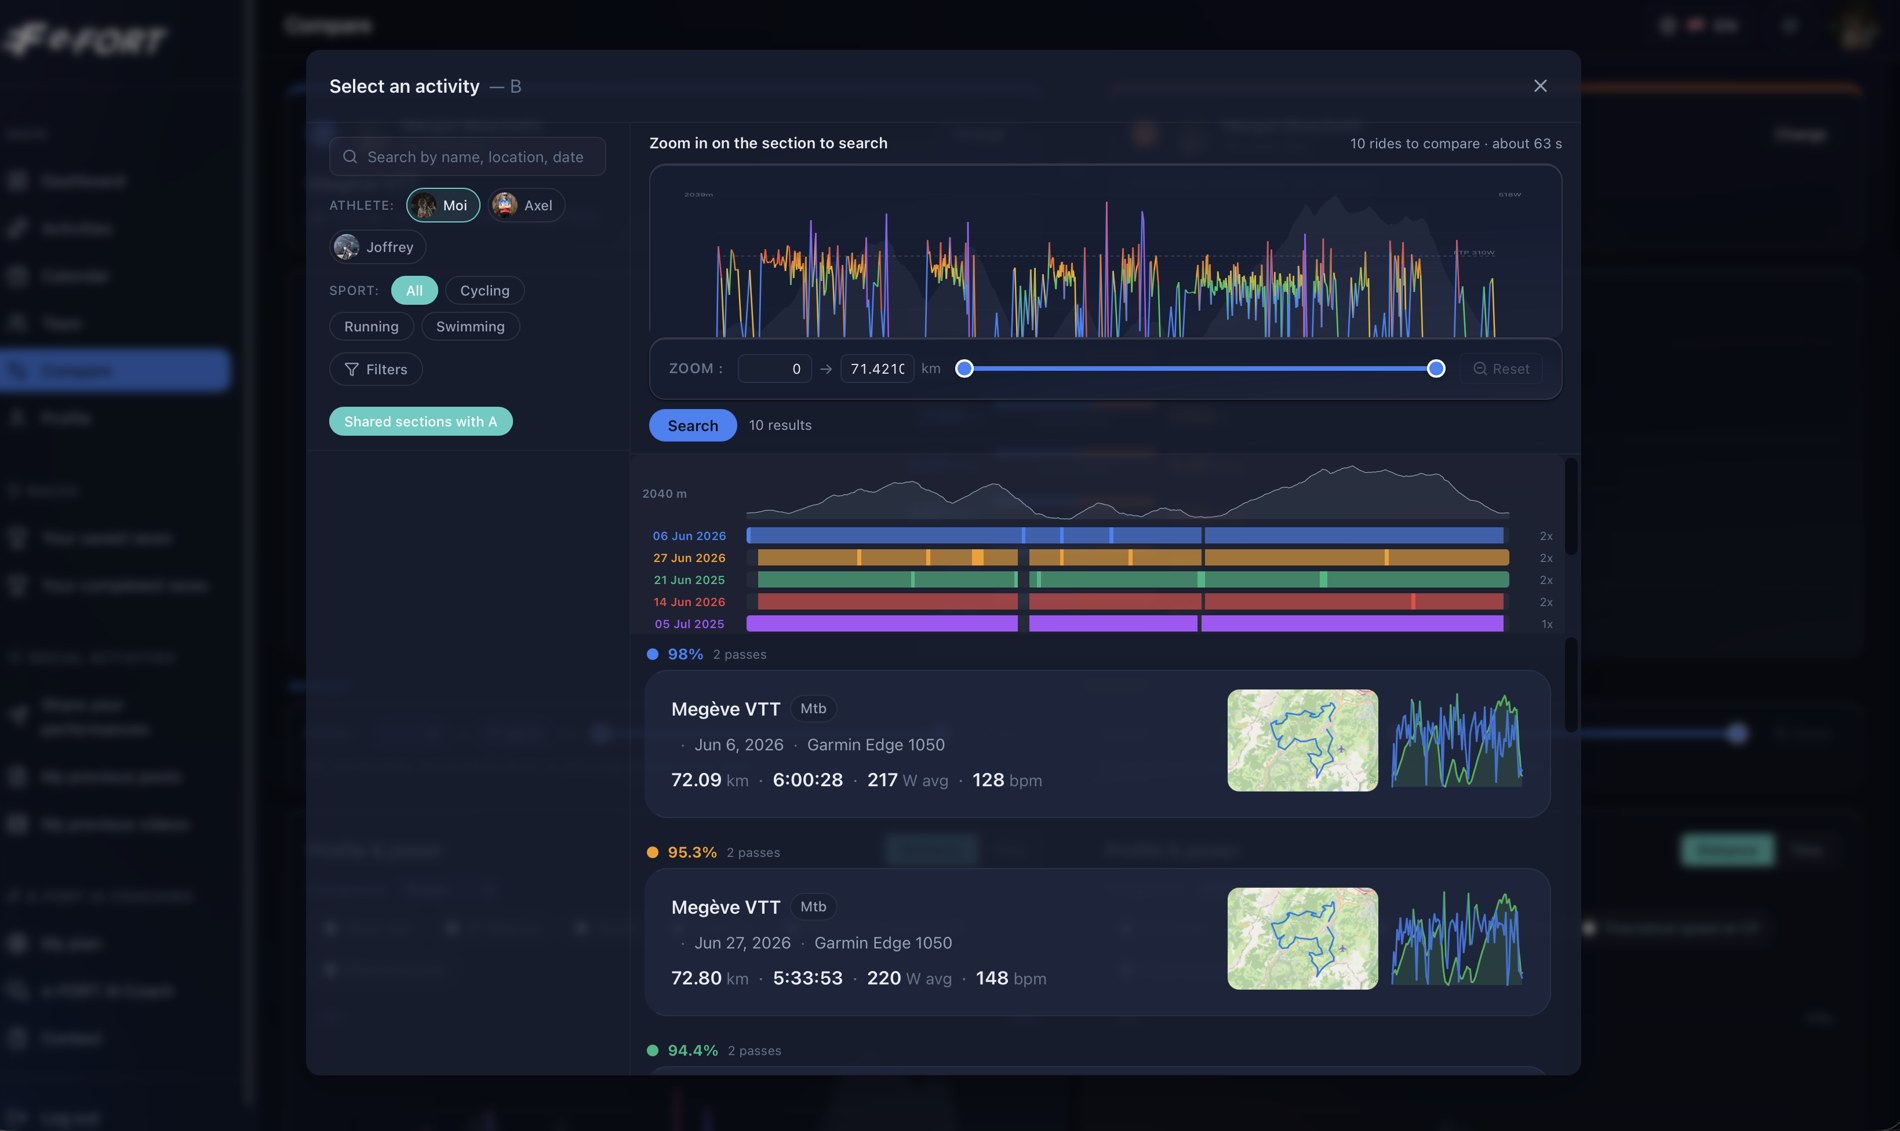
Take any ride as a reference, zoom on the portion that interests you, and e-FORT AI searches your whole history for the times you have already ridden it — with a match score for each. No imposed route, no waiting for someone else to create the segment.
Ten rides compared in about a minute, sorted by how well they overlap. Two passes on the same ride count as two.
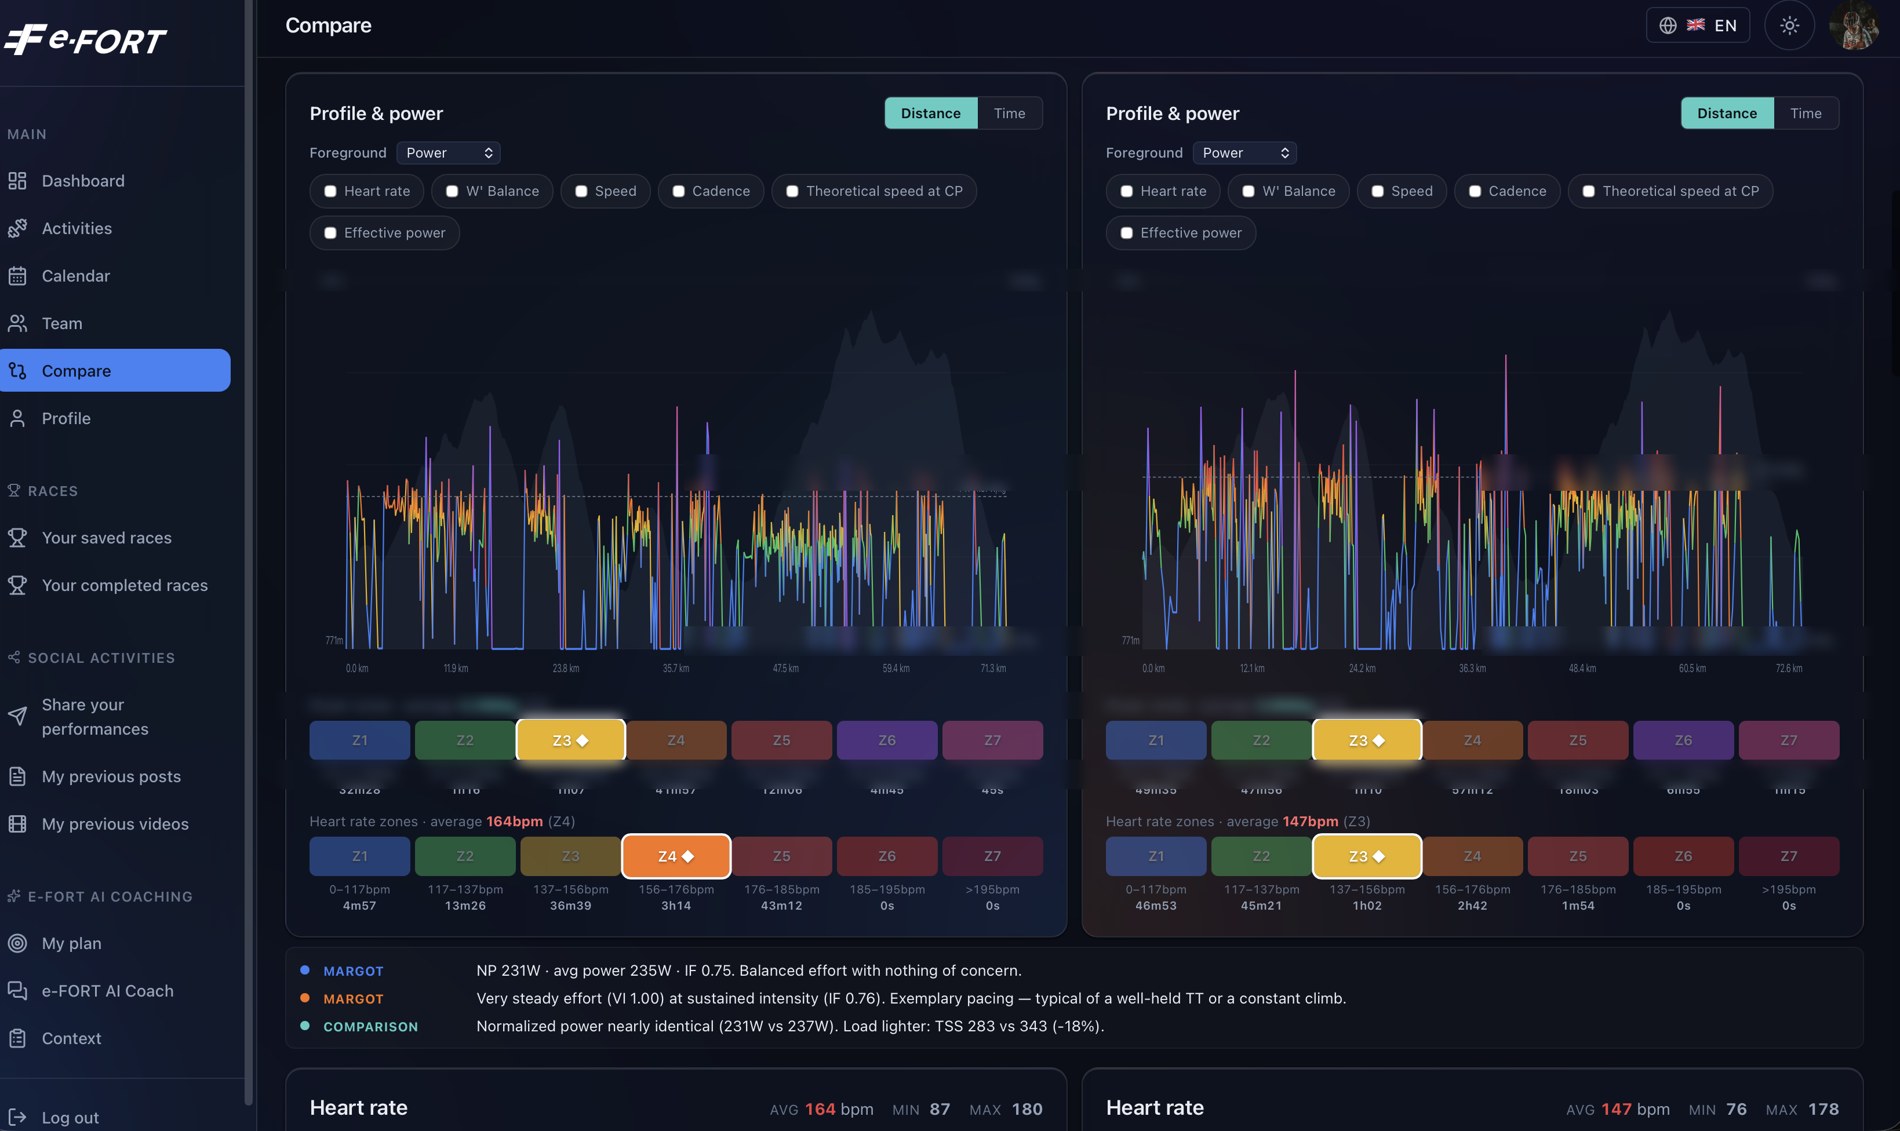
The same overlays on both panels: heart rate, anaerobic reserve, speed, cadence, theoretical speed at critical power. Time in each zone, distribution, averages — read in parallel rather than one after the other.
And the comparison is stated, not left to you: normalised power nearly identical, load 18 % lighter.
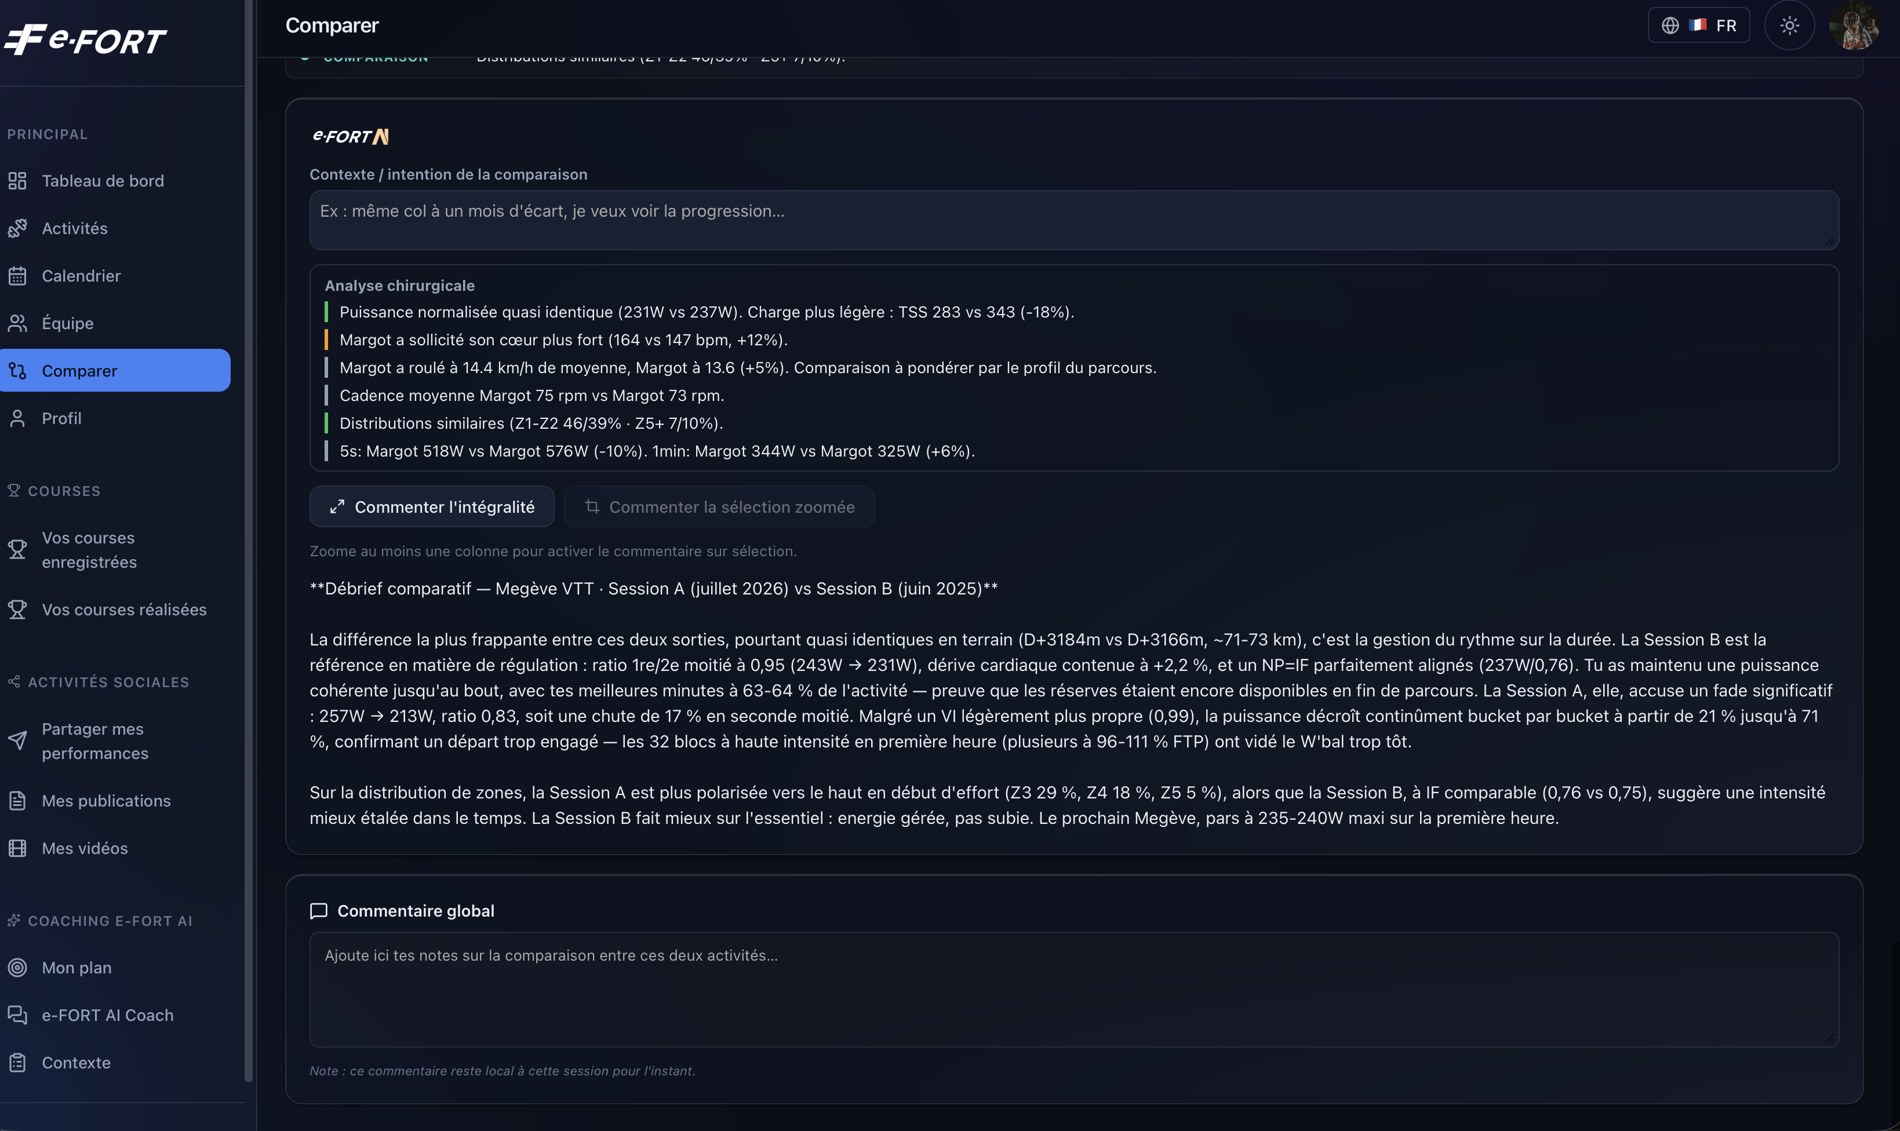
Six lines of surgical reading, then a written debrief. Not a summary of the figures — a judgement on how the two efforts were managed, and what to do about it next time.
“The second half fades by 17 %. Thirty-two high-intensity blocks in the first hour emptied the reserve too early. Next time, 235 to 240 W maximum over the first hour.”
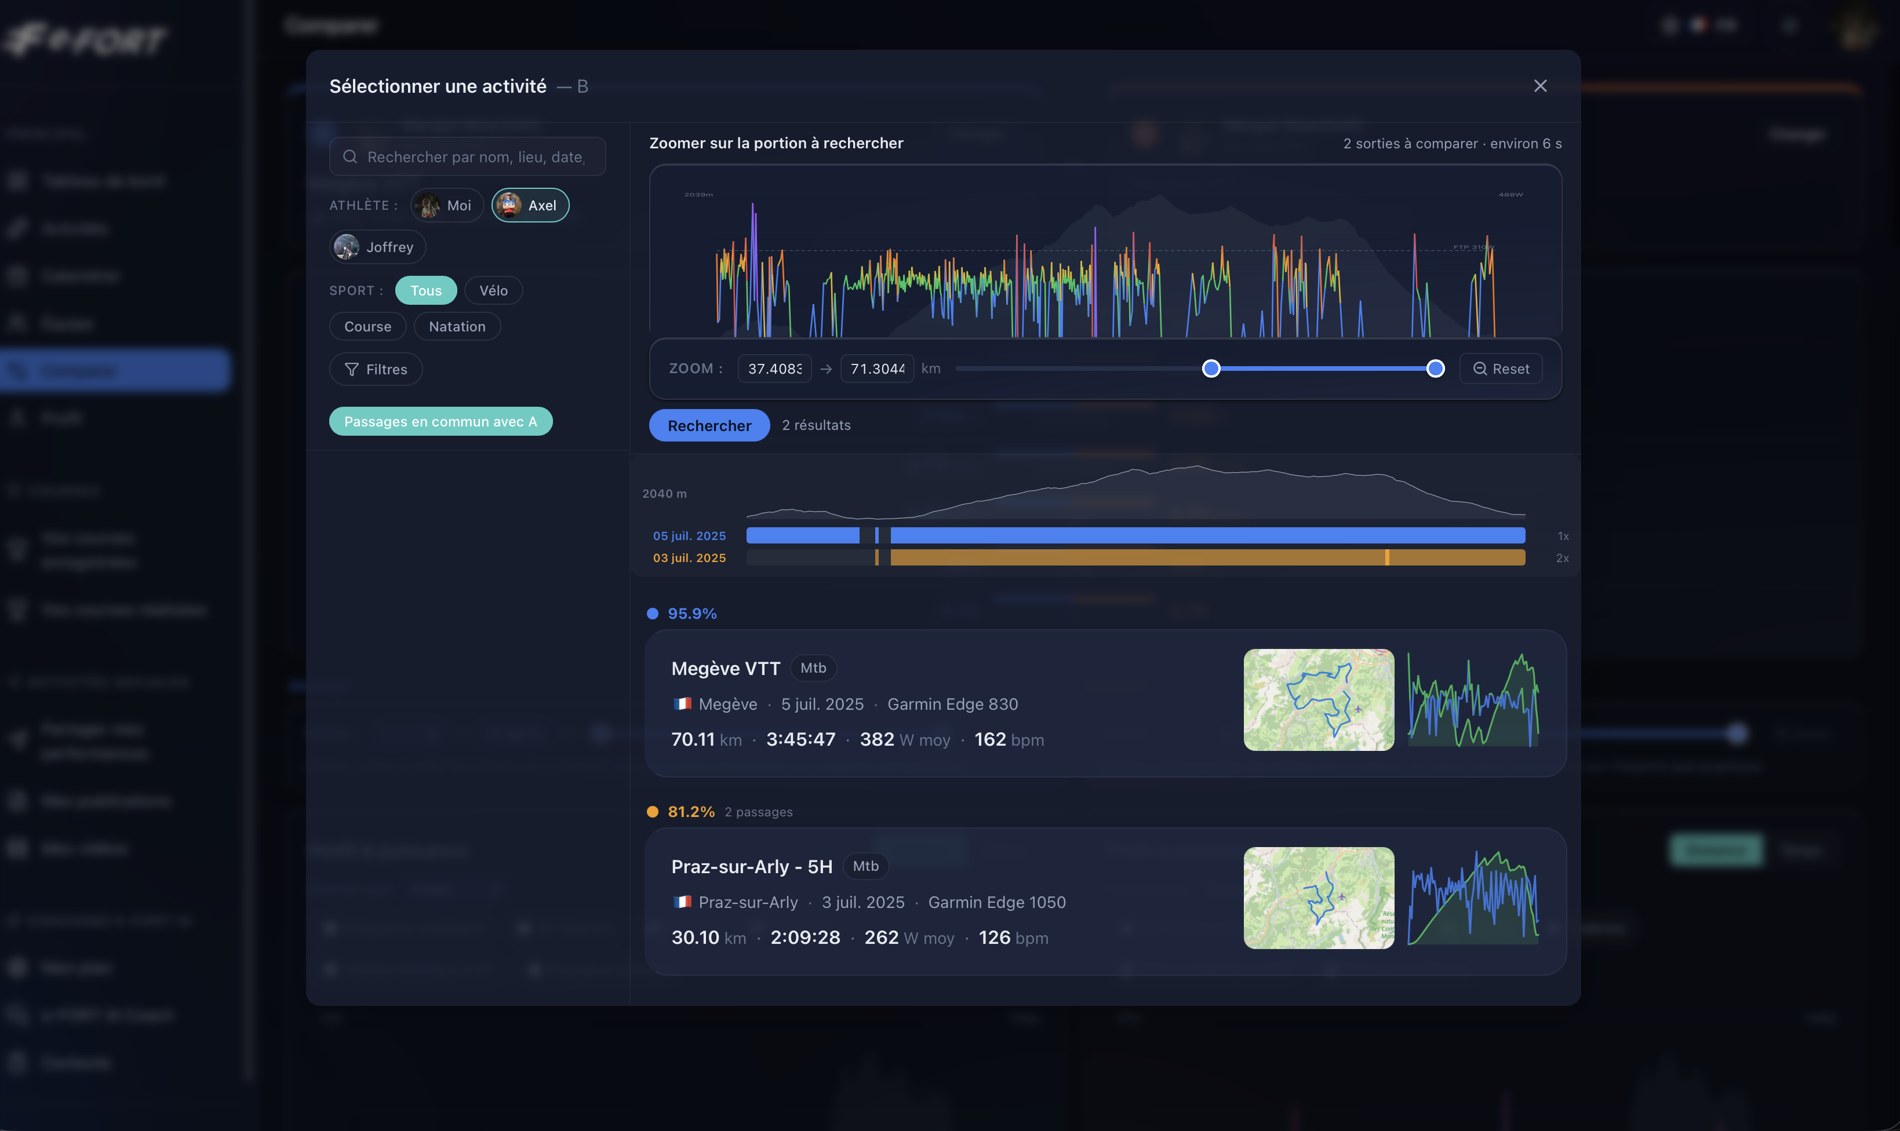
Narrow the search to the section that matters — one climb, one descent, one technical passage. And switch athlete: the same portion, ridden by a team-mate, appears with their own figures.
This is the comparison that used to require an expert coach with both files open. It takes six seconds.
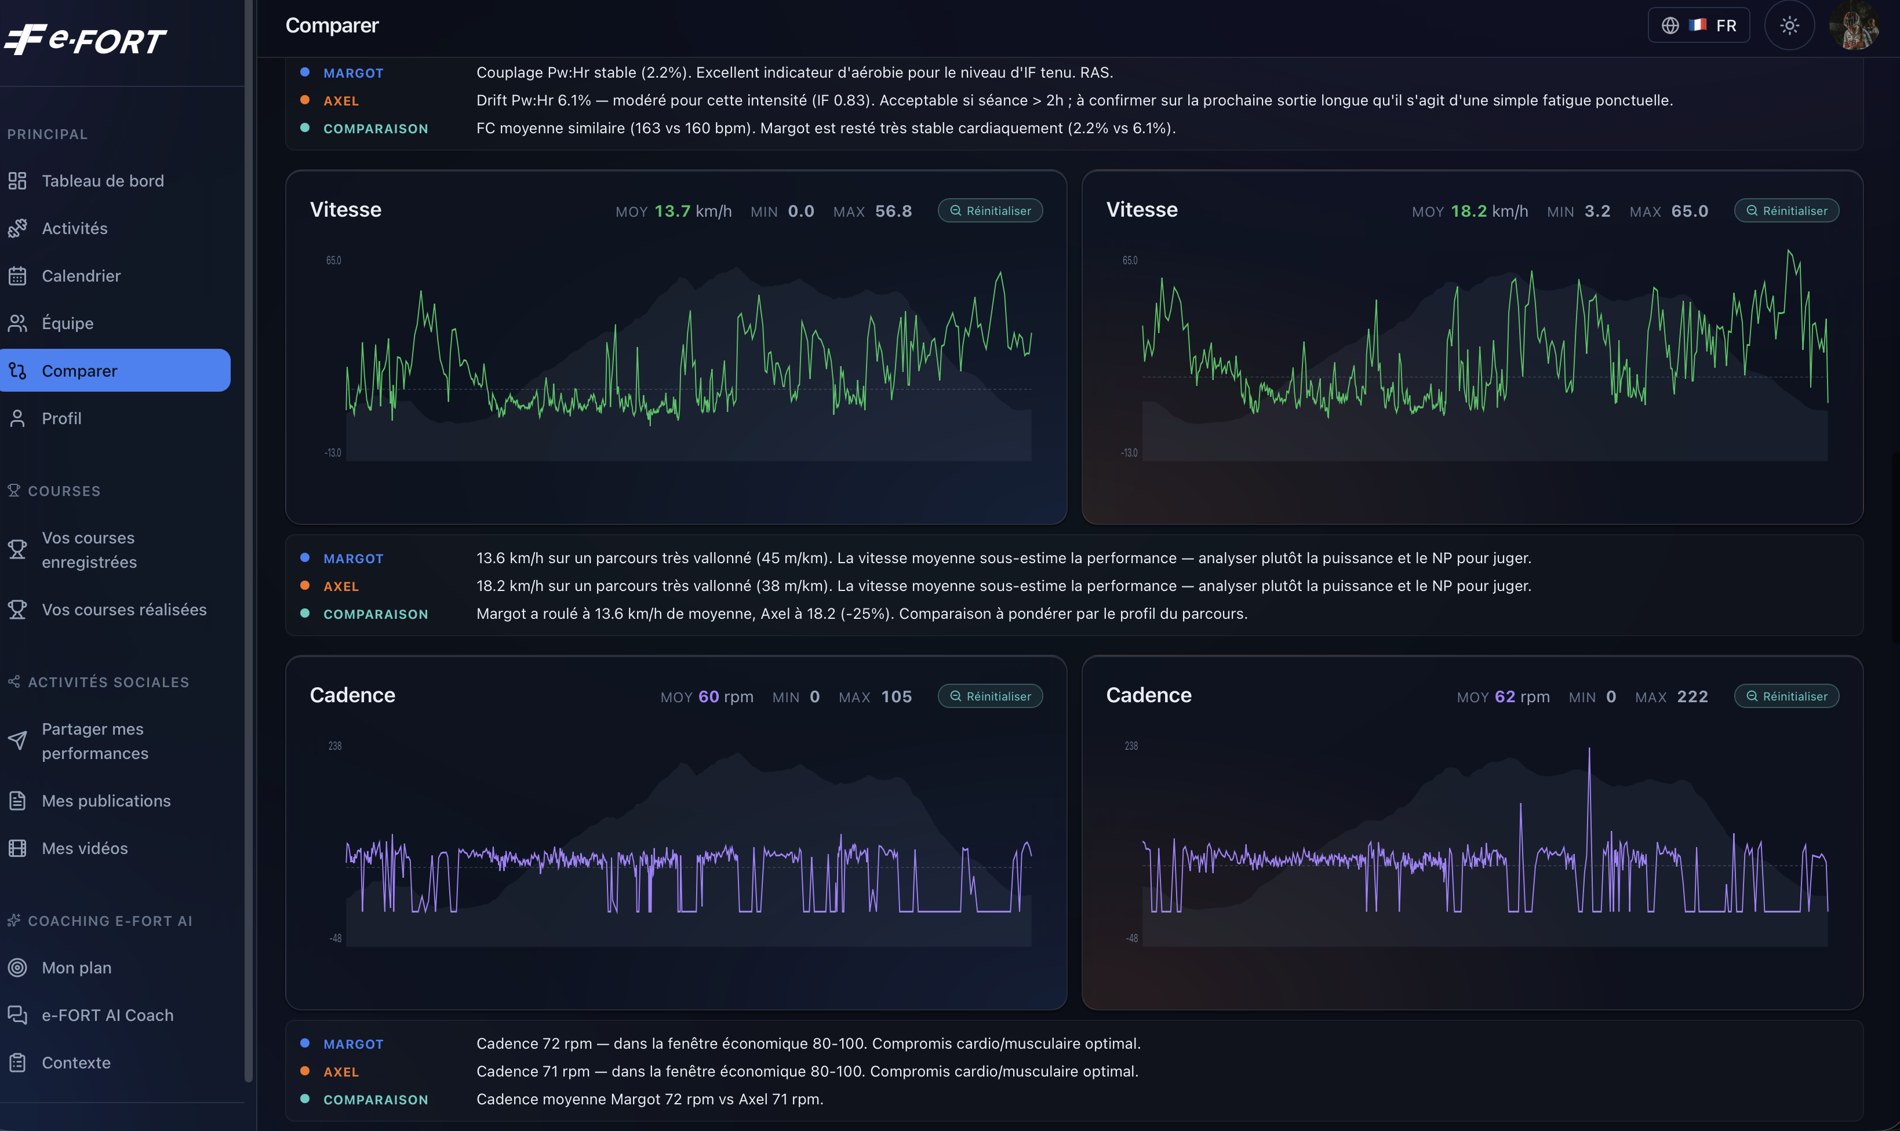
Zoom in and nothing keeps the values of the whole ride: speed, cadence, heart rate, distribution and averages are recalculated over the selection only. The commentary follows — and so does the caution about reading it.
Multi-athlete comparison is included in Pro. Section search and comparison of your own rides from Premium.
See pricingA plan that changes when your night changes.
Plan · Week 14
Recomputed this morning · 07:04
| Day | Session | Target |
|---|---|---|
| LUN | Rest | — |
| MAR | Endurance Z2 | 198–215 W · 90′ |
| MER | Recovery (HIT moved) | 160 W · 60′ |
| JEU | HIT 4×8 min | 285 W · 32 min |
| VEN | Active recovery | — · 30′ |
| SAM | Long Z2 + sprints | 210 W · 4 h |
| DIM | Simulated race | racing |
Every morning, e-FORT reads your recovery and rebuilds the week. A bad night? Wednesday’s interval block becomes zone 2. Recovering well? It brings a key session forward to make the most of it.
Each session comes with its target, its purpose and its explanation. In watts for the cyclist, in pace for the runner.
Morning message
Tuesday 21 July · 06:48
Overnight HRV
62 ms
− 12 %
Resting HR
44 bpm
+ 4 bpm
Modelled fatigue
− 8
7-day load
Nocturnal heart-rate variability, resting heart rate, modelled fatigue. Push, hold or recover — with the target, and the physiology behind the recommendation.
Everything about the AI coachIncluded from Premium, €8.49 a month.
See pricingRide alone. Improve together.
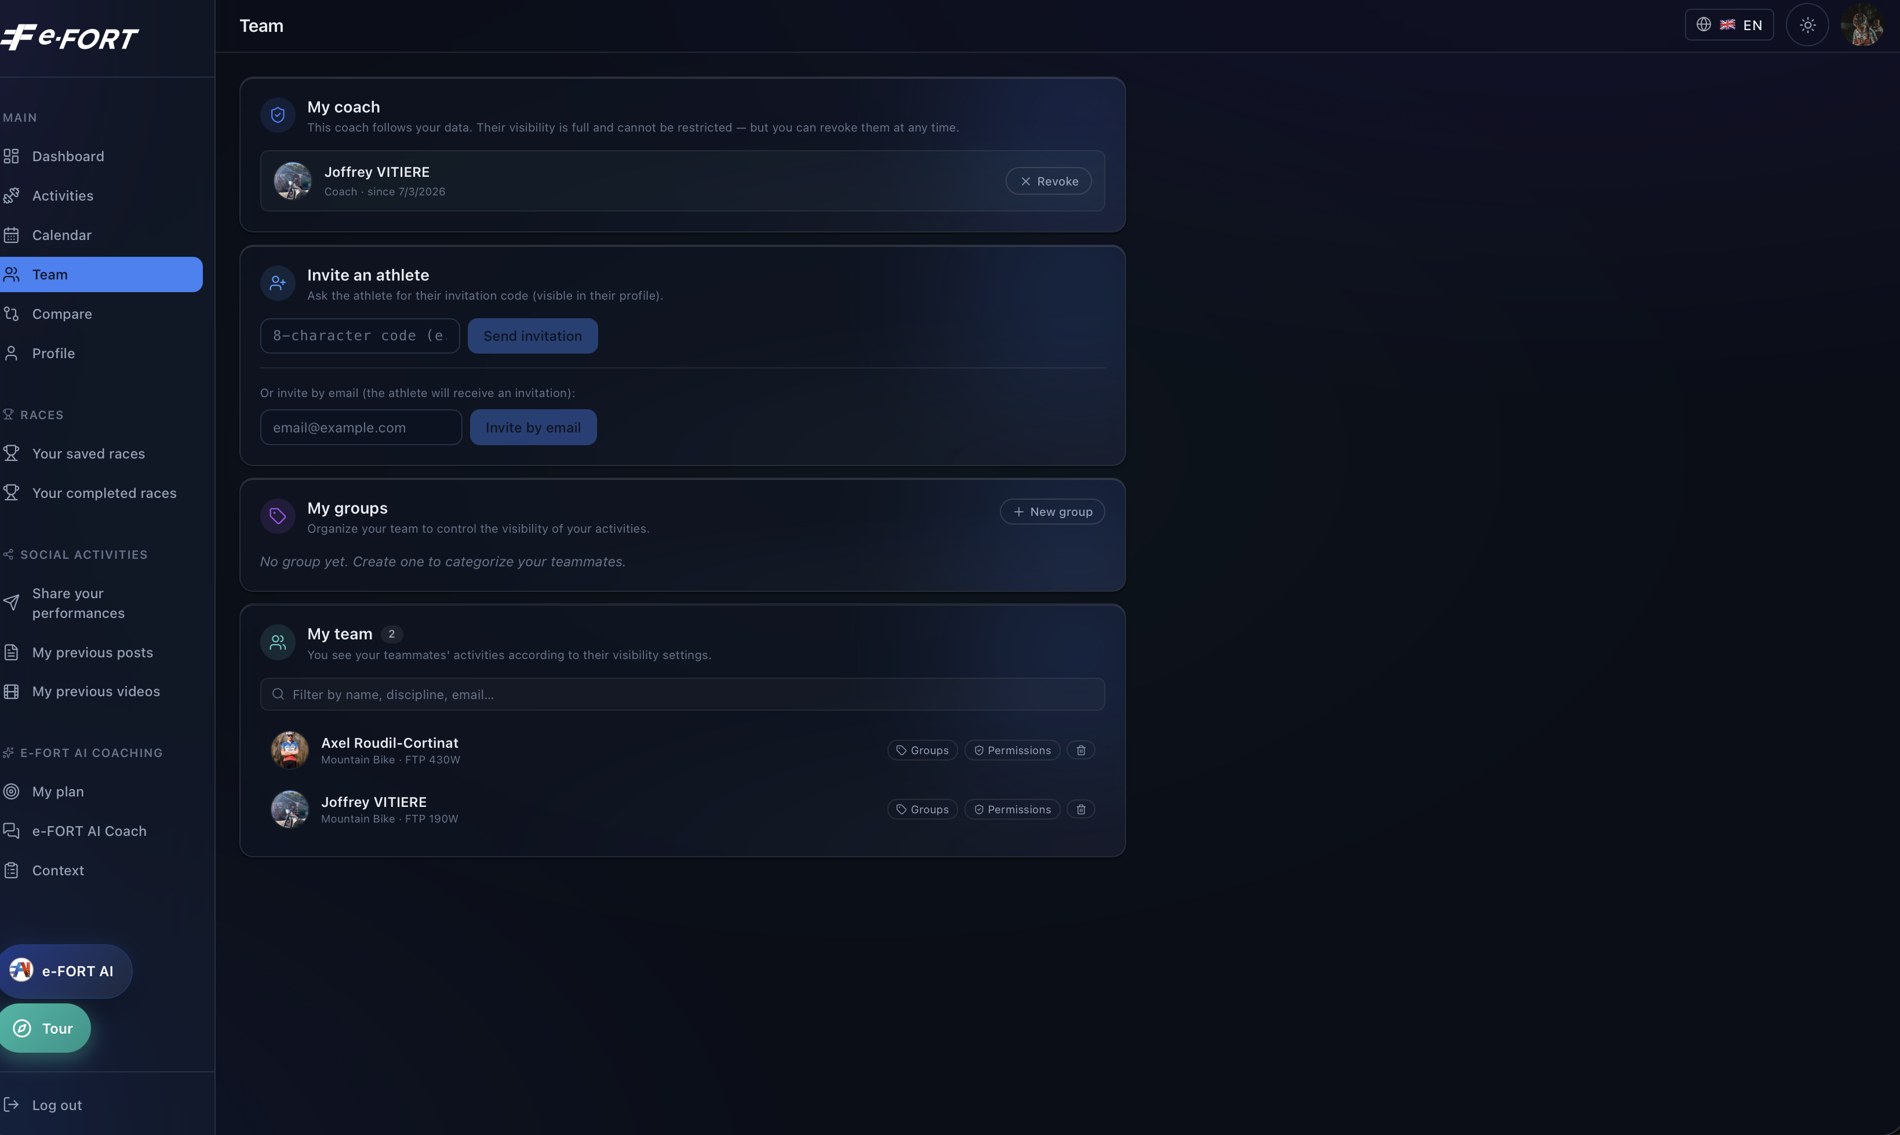
An eight-character code, or an email invitation: team-mates, training partners, the rivals you train against all join your circle. You then sort them into groups — the club squad, the Tuesday-night crowd, the ones preparing the same race as you.
And if a coach follows you, they sit at the top with full visibility — which you revoke in one click, whenever you decide, without asking them.
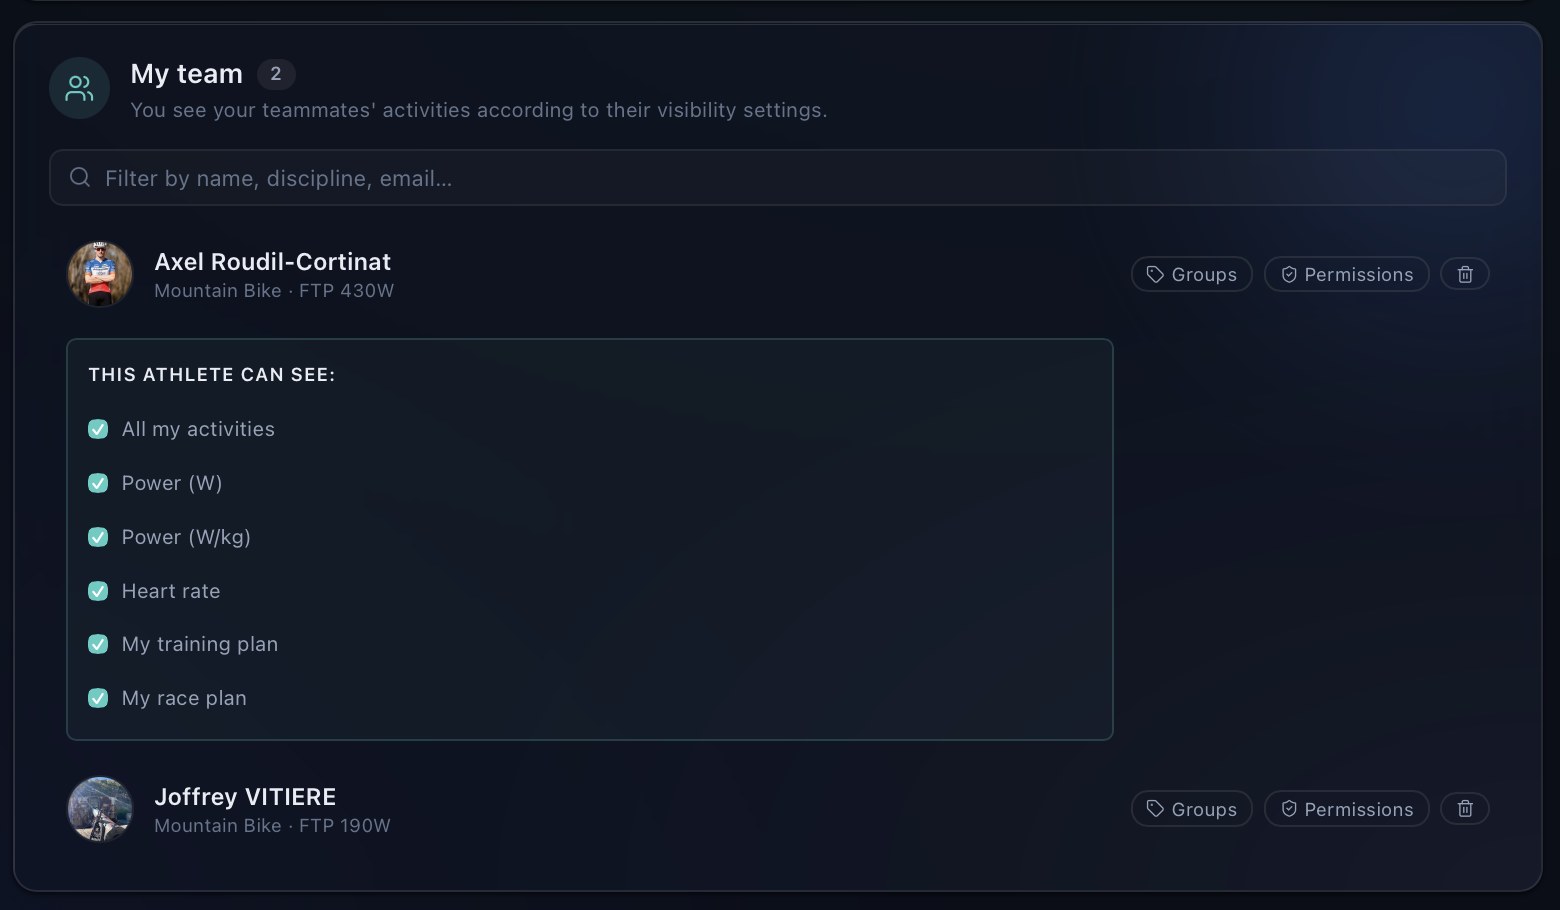
Six independent permissions, athlete by athlete: your activities, your power in watts, your power relative to weight, your heart rate, your training plan, your race plan. A training partner can see your watts without seeing your watts per kilo. Your race plan can stay closed to everyone.
It is the opposite of a social network, where you publish to everybody or to nobody. Here the opening is decided athlete by athlete, line by line.
Comparing your data with a team-mate’s is included from Premium.
See pricingArrive on the start line with a plan, not a hope.
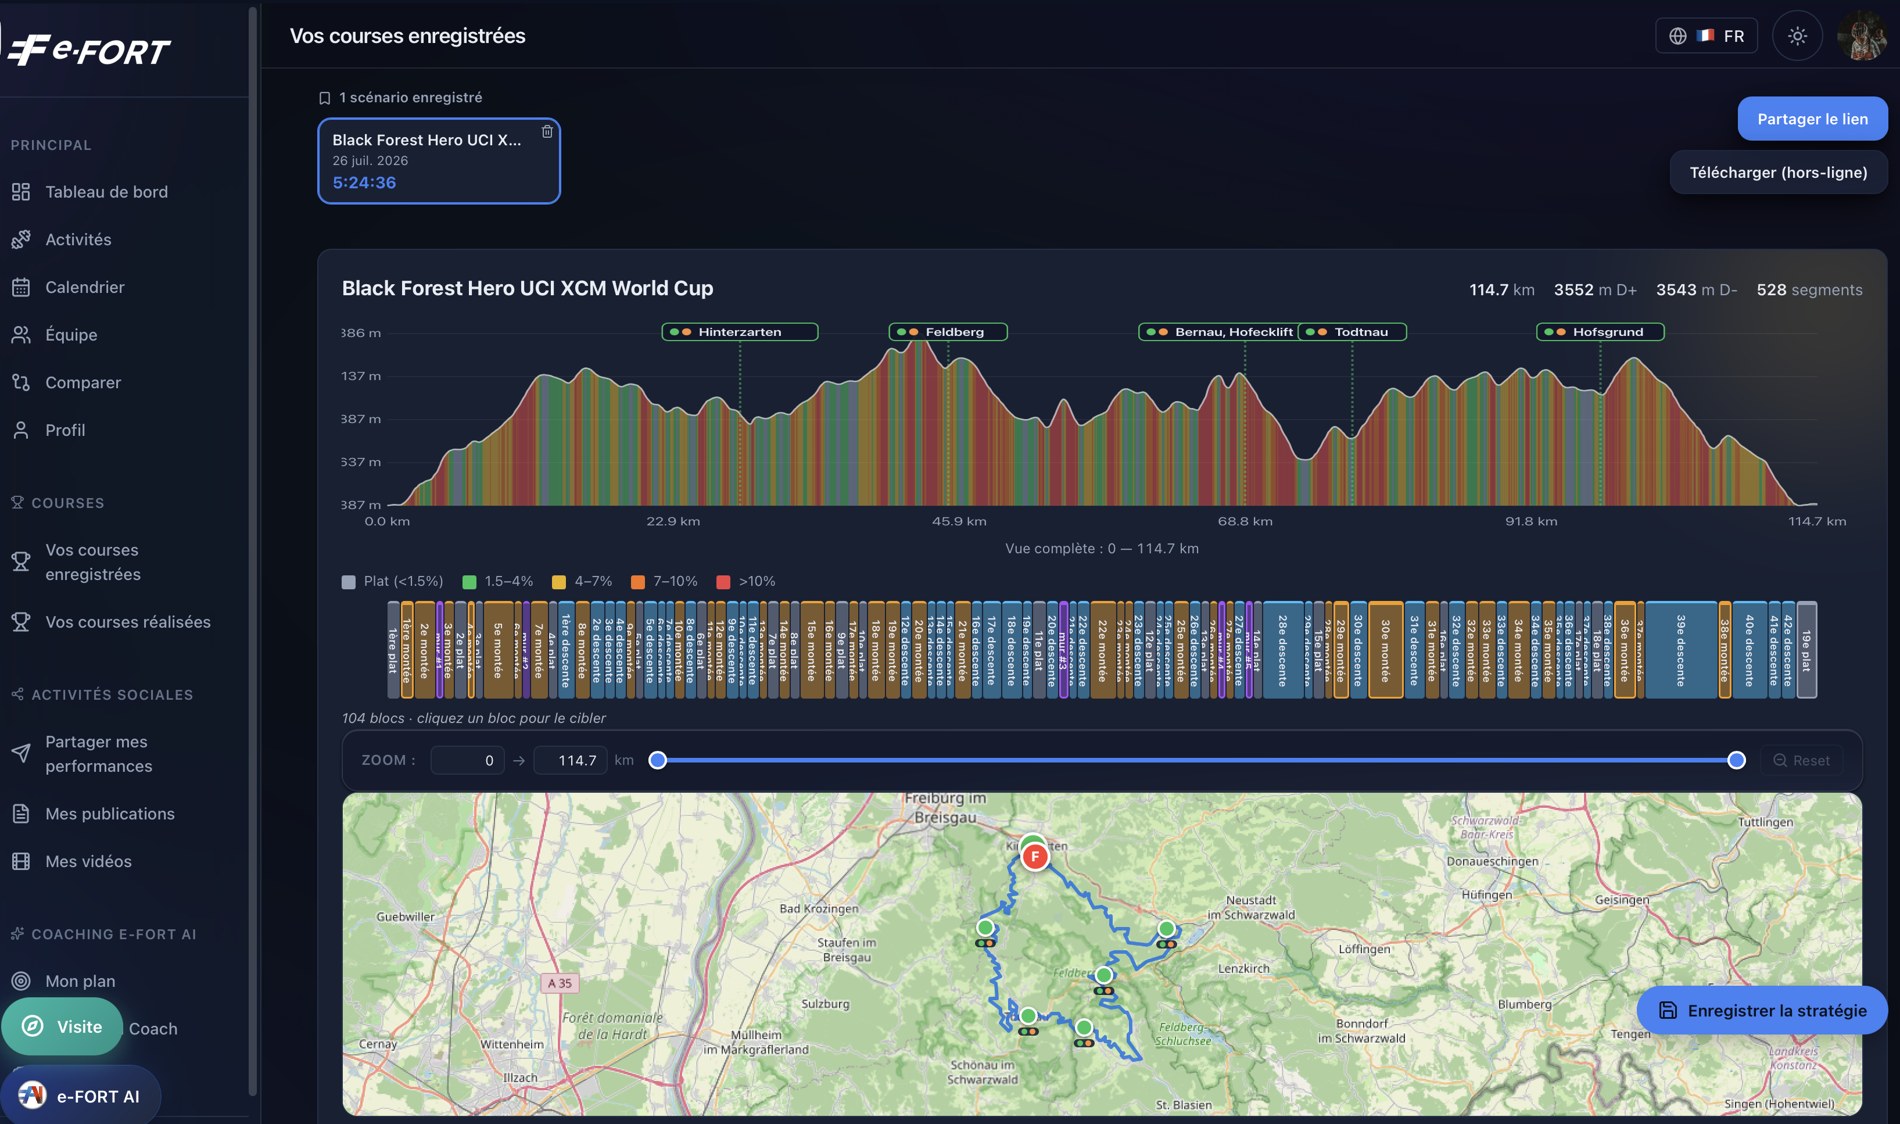
Organisers usually publish only a profile image to protect their route. e-FORT extracts distance, elevation and gradient from it, metre by metre, and builds the strategy from there. What professional teams did by hand in hours now takes seconds.
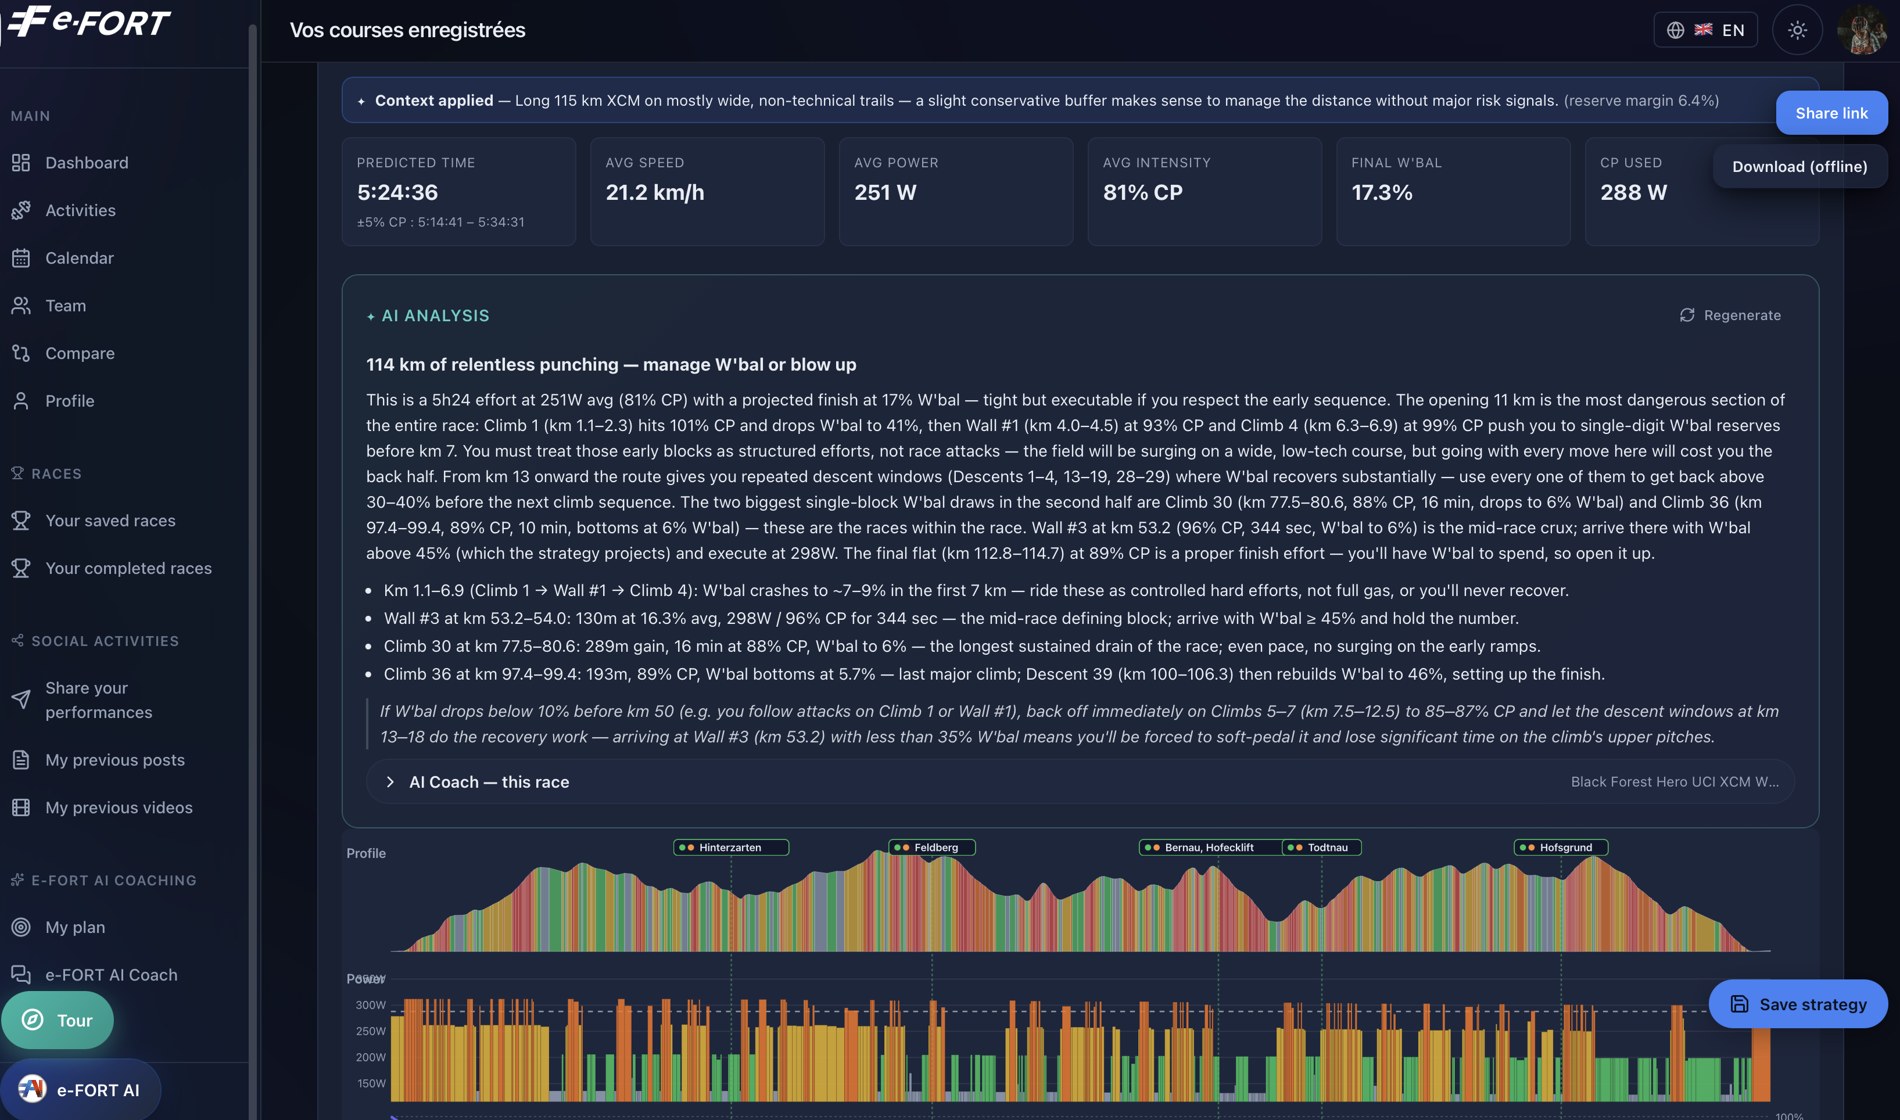
Full physics — drag, rolling resistance, gravity, inertia — combined with your own parameters. The strategy is converted and sent straight to your bike computer, where your target appears segment by segment, triggered by distance rather than by time.
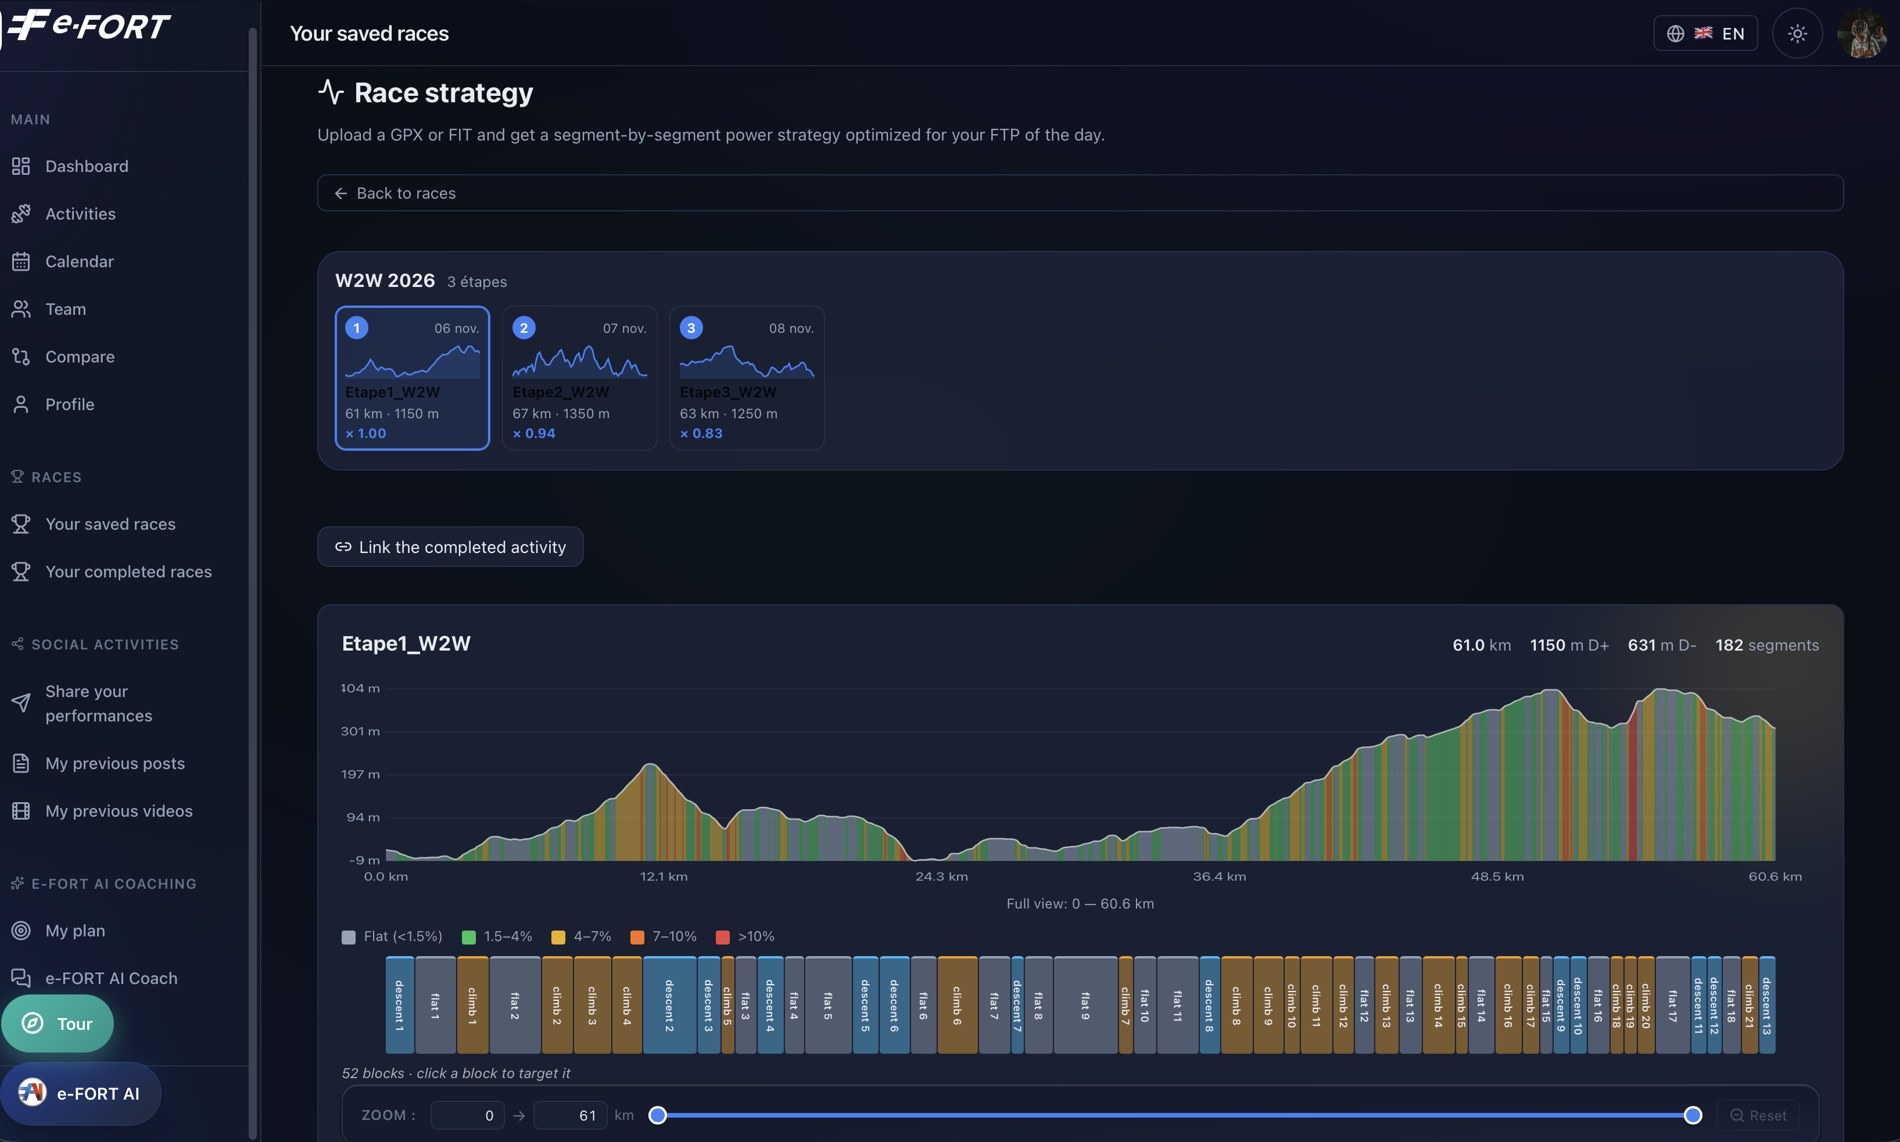
On a stage race, e-FORT projects your effective capacity day by day: accumulated fatigue, morning HRV, nutritional intake. Each stage carries its own coefficient — here 1.00, then 0.94, then 0.83. You know before the start that the last day will be raced at 83 % of your fresh capacity, and you calibrate from Day 1 instead of blowing up mid-event.
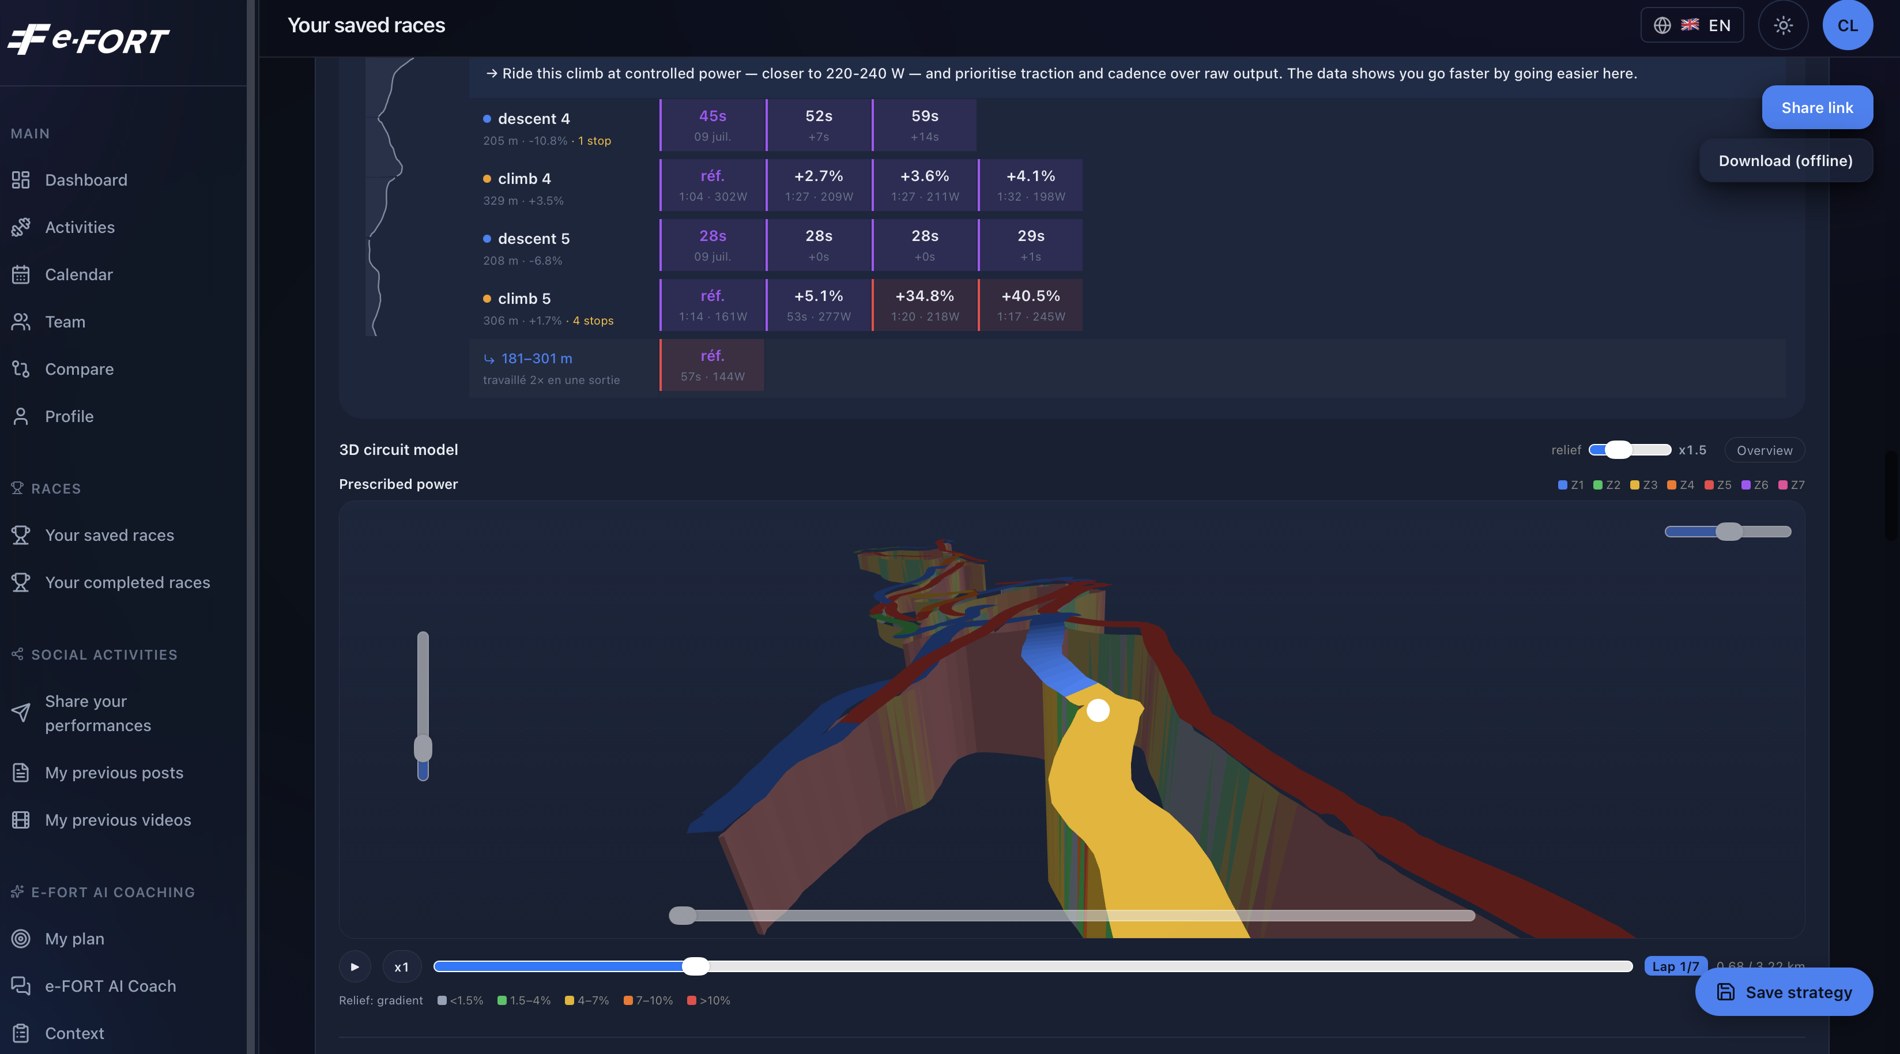
A course profile is an abstraction — a line on a chart that tells you nothing about the corner you are about to take. The 3D circuit model turns it into an object you can rotate, fly over and replay, with the prescribed power painted onto the ground, zone by zone.
You stop reading a table of segments. You recognise the corner before you reach it.
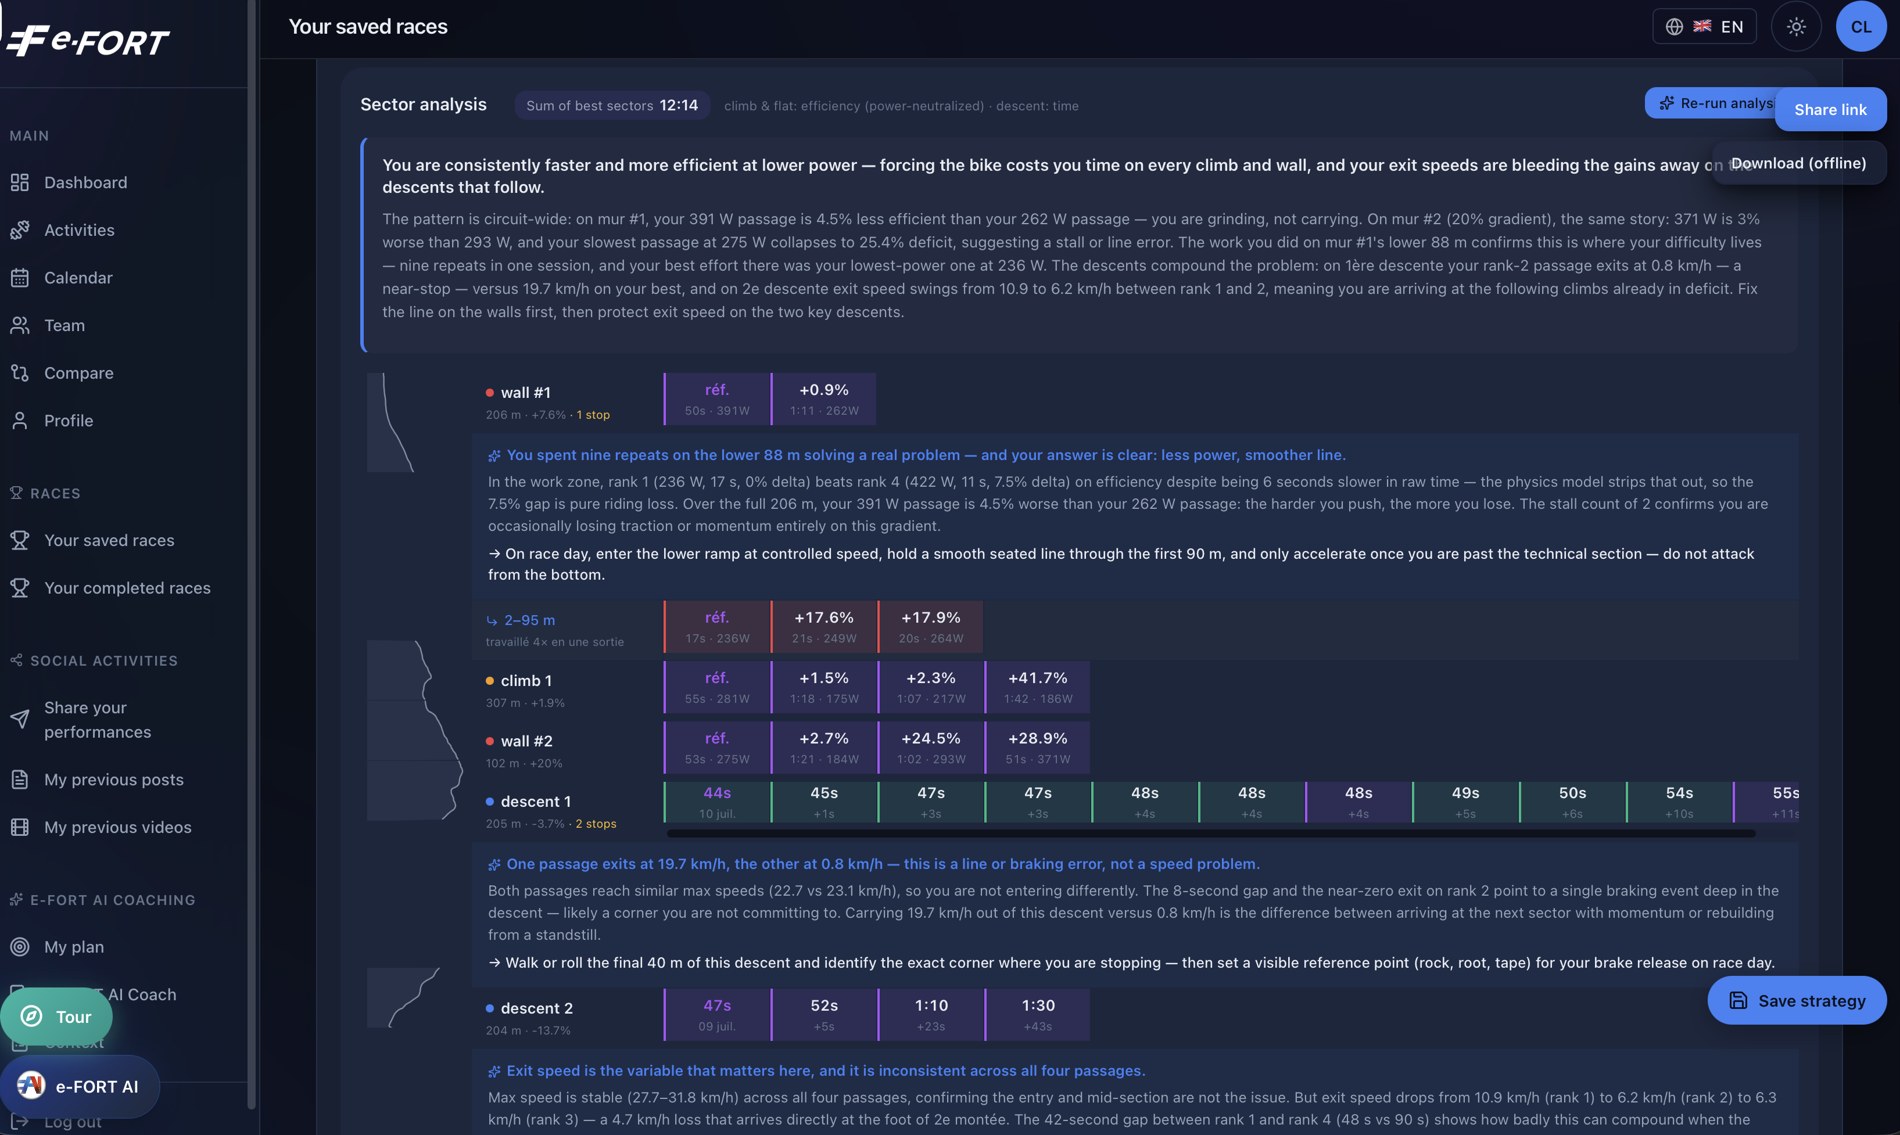
On a circuit you ride the same metre several times. e-FORT lines up all your passages, neutralises the power difference through the physics model, and tells you what is left — which is almost never the power.
Race craft is trainable once you can see it. This is the part of performance no power meter has ever shown you.
Included in Pro, €24.90 a month.
See pricingWhat you did deserves to be seen.
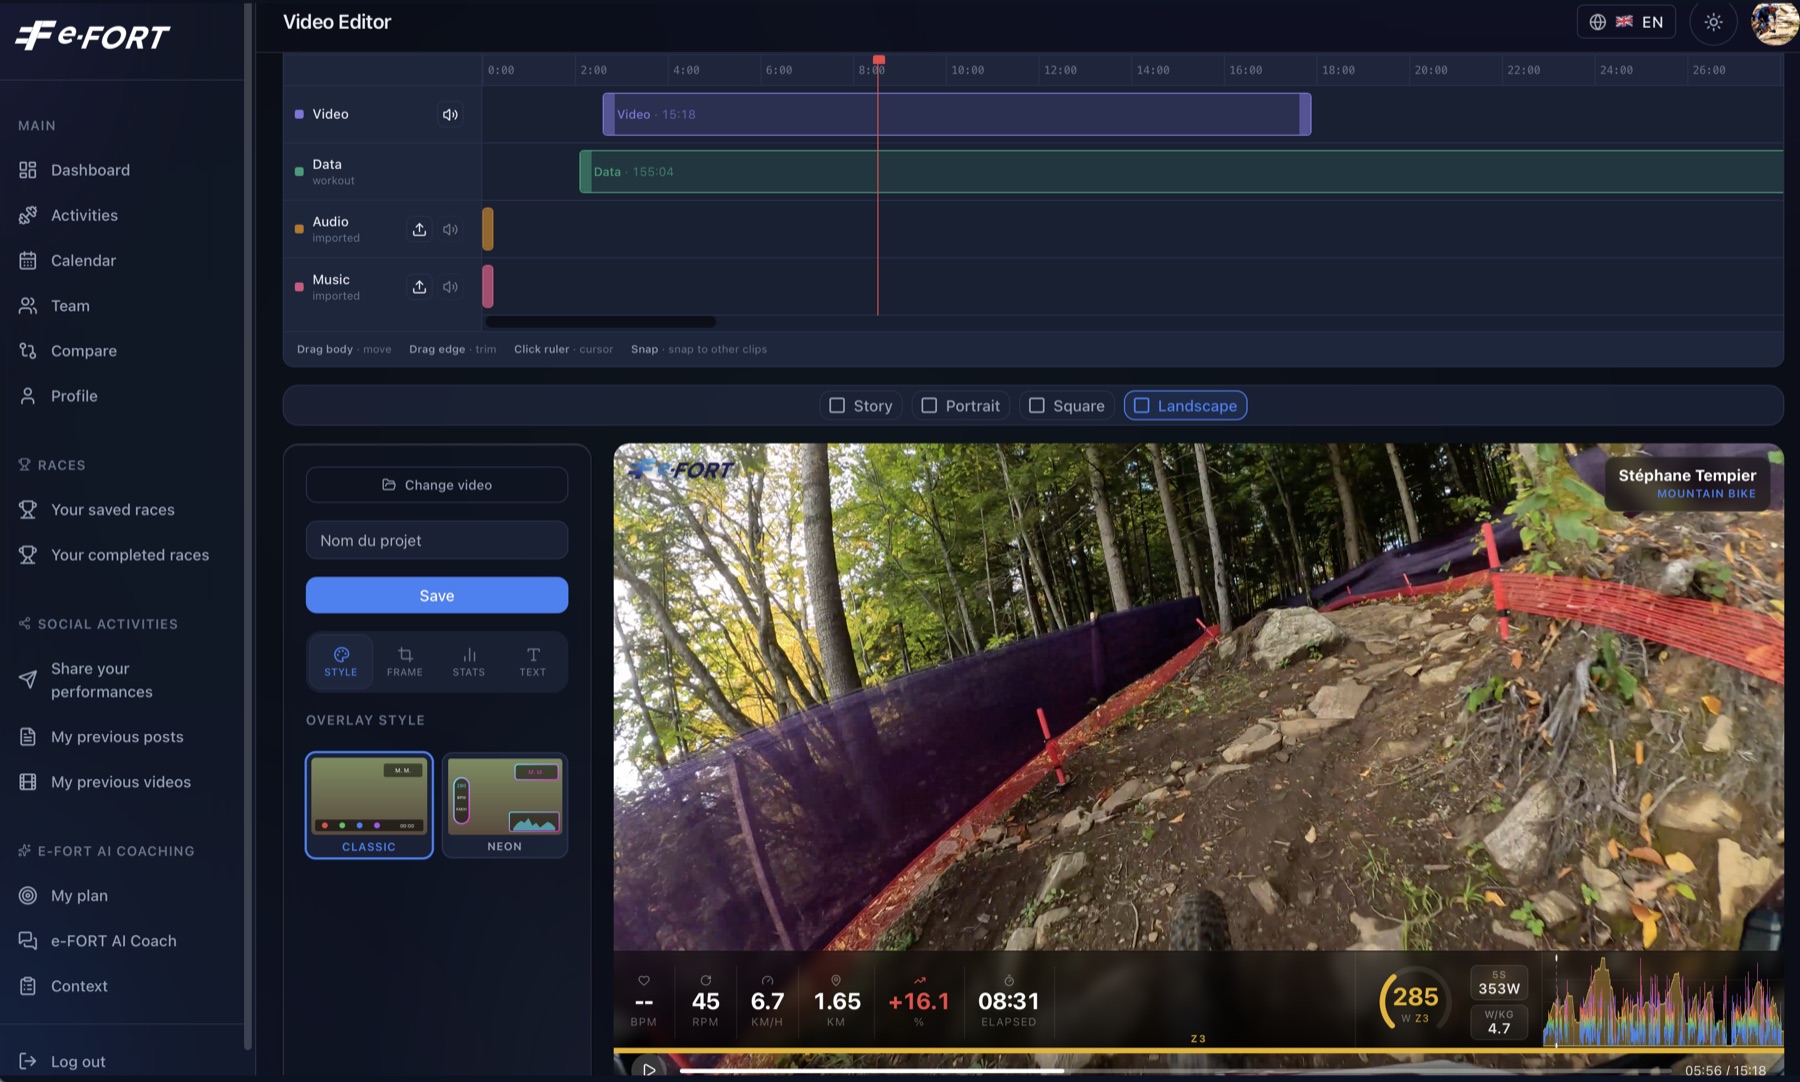
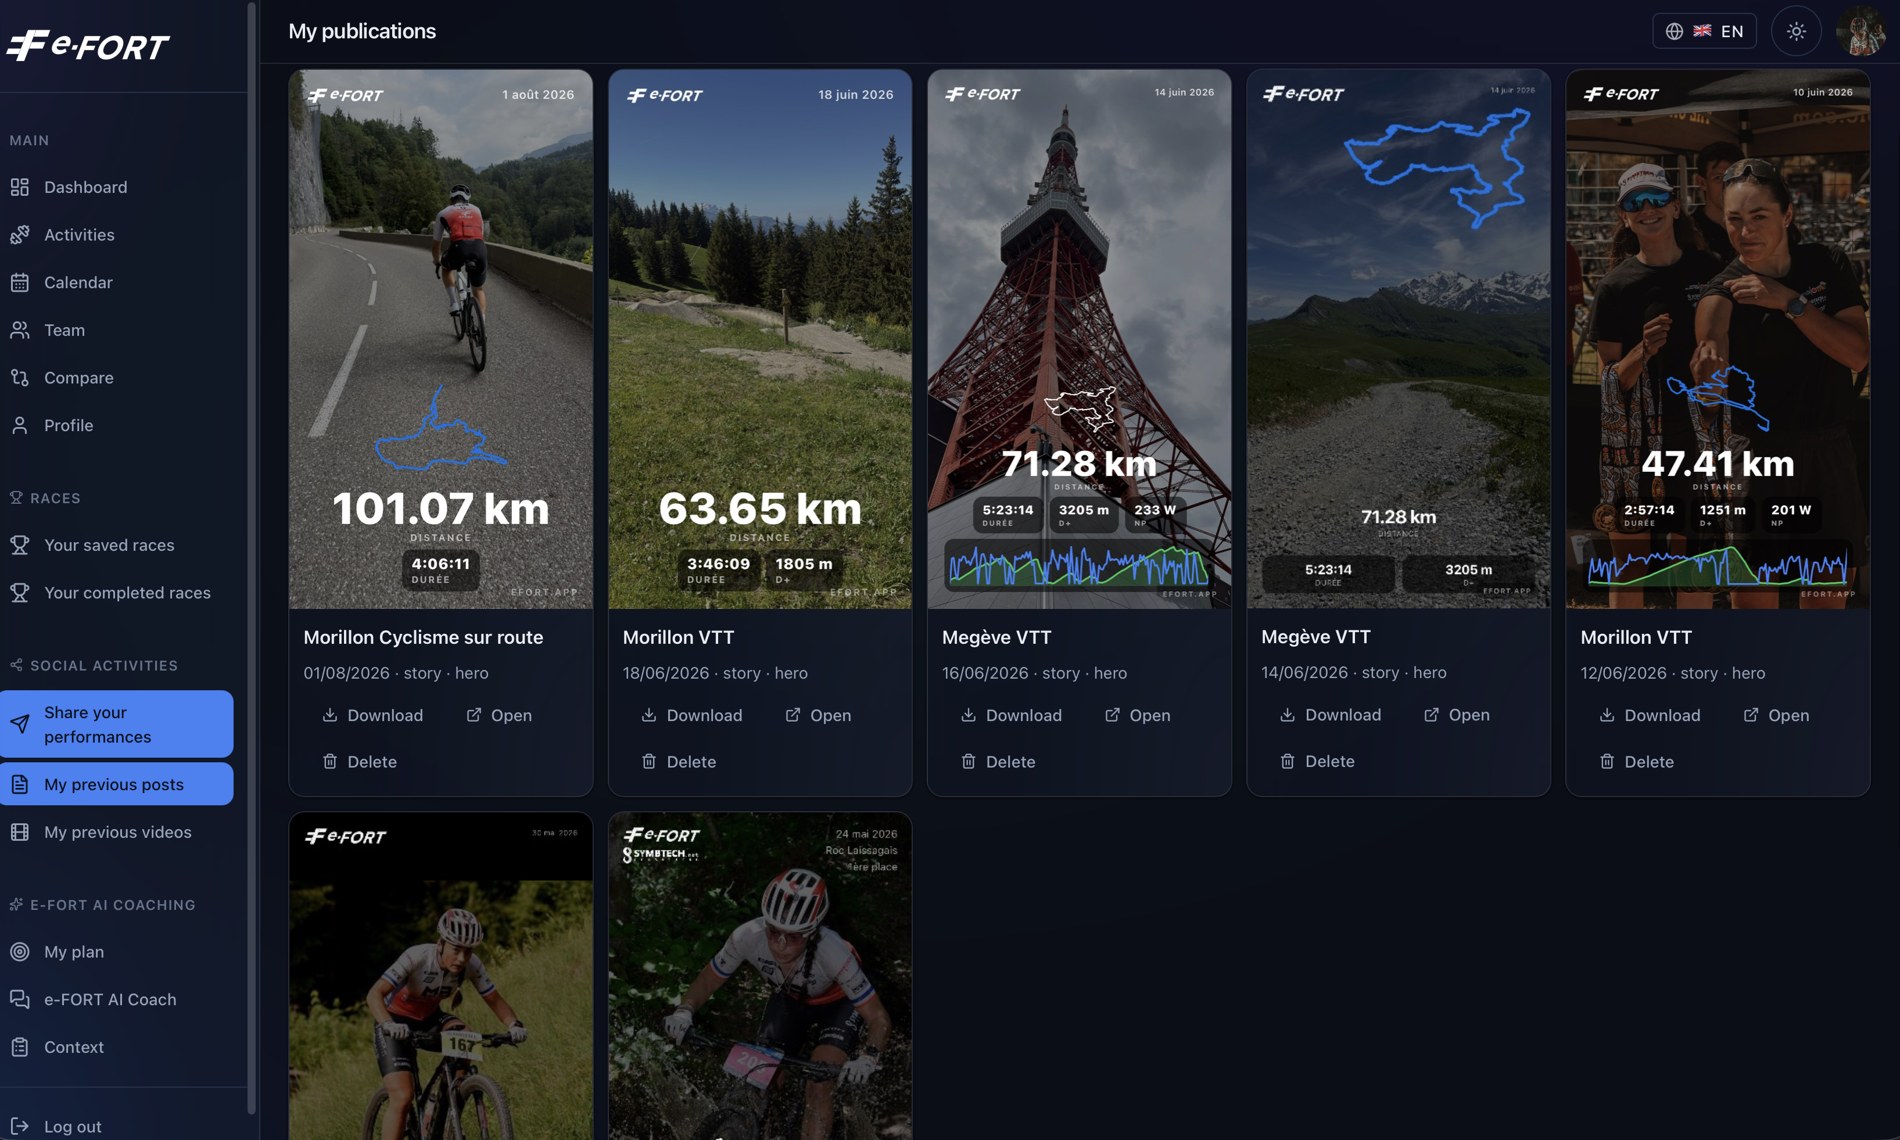
Watermark-free from Creator, €2.49 a month — included in Premium.
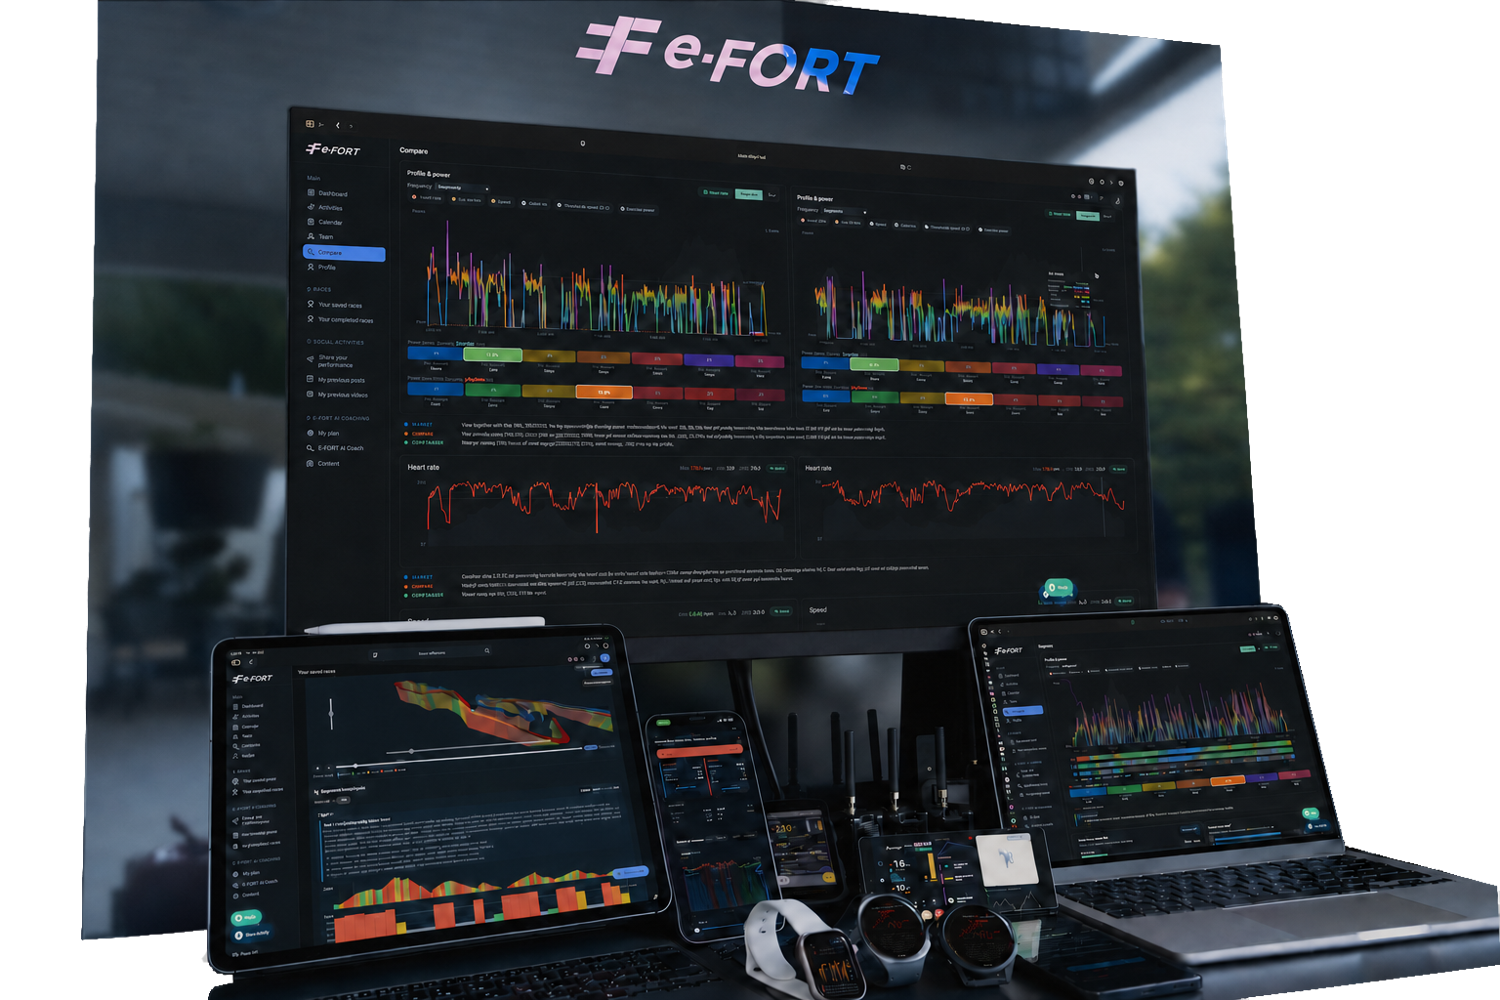
See pricingOne dataset, six screens, one single truth.
None of them recalculates its own version of the truth. Whichever screen you look at, the number is the same — and it is the one that took your night and your last 42 days into account.
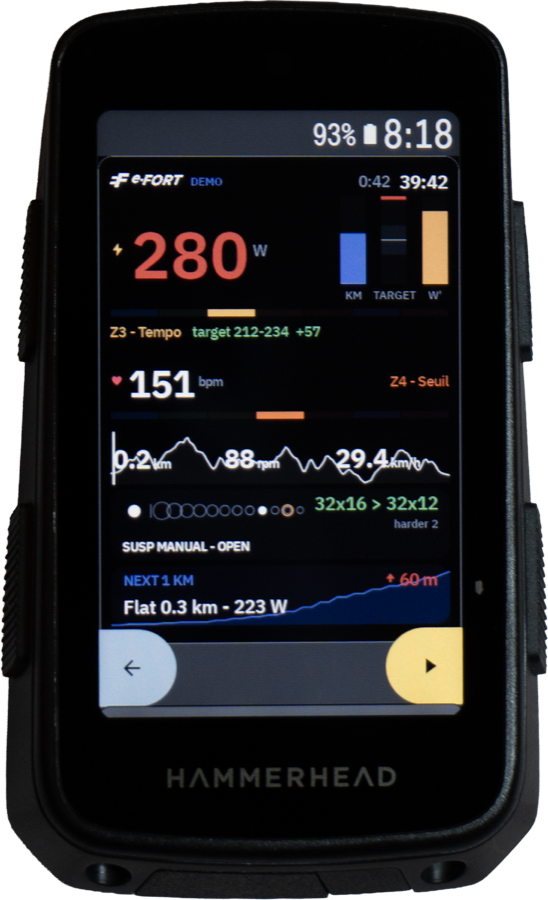
Your capacity today, calculated from 42 days of history and corrected by the night just completed — displayed on the handlebar, in race, where it matters. Nothing else does this.
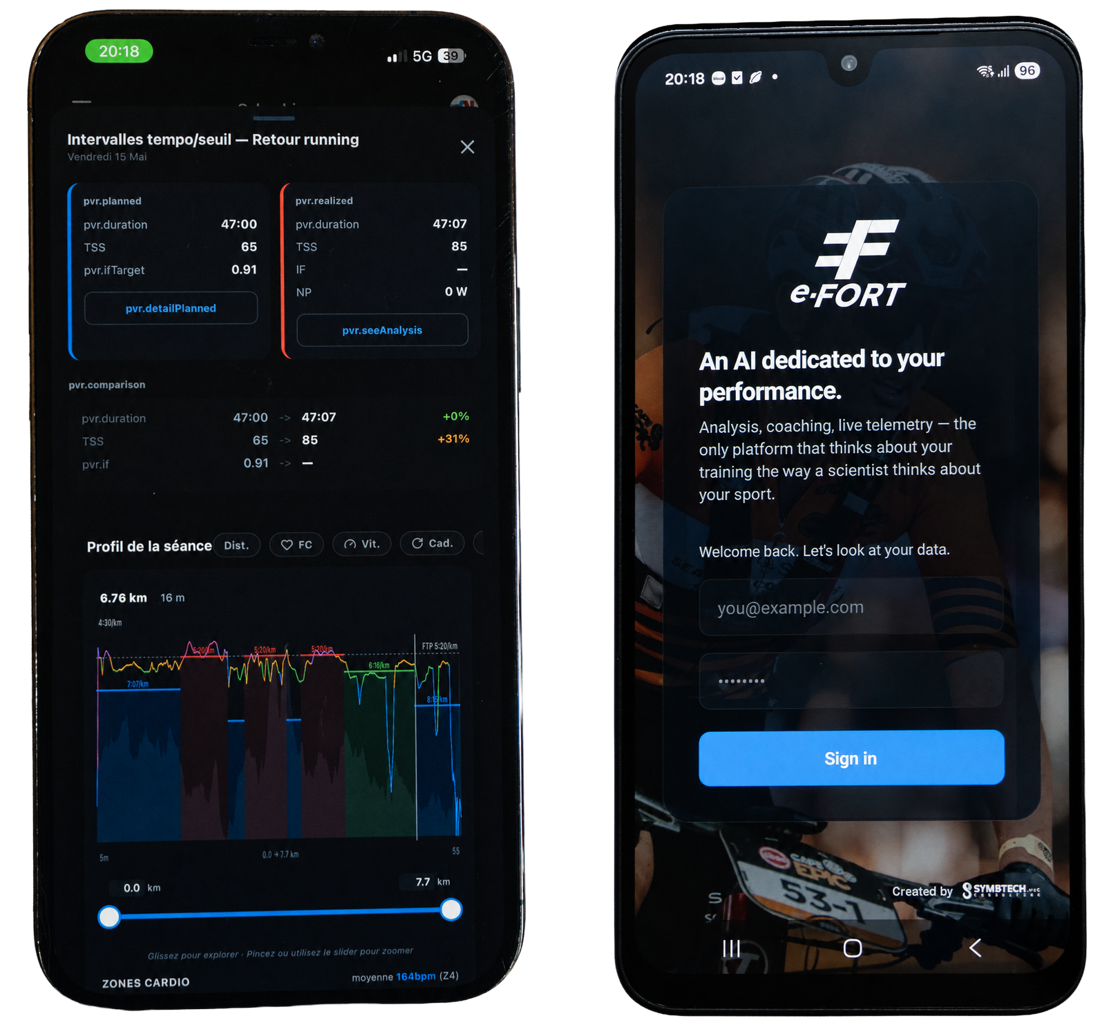
iPhone and Android
Native application
The same application on both platforms, with the same models running underneath. Your history is there from the first sync — no export, no file.
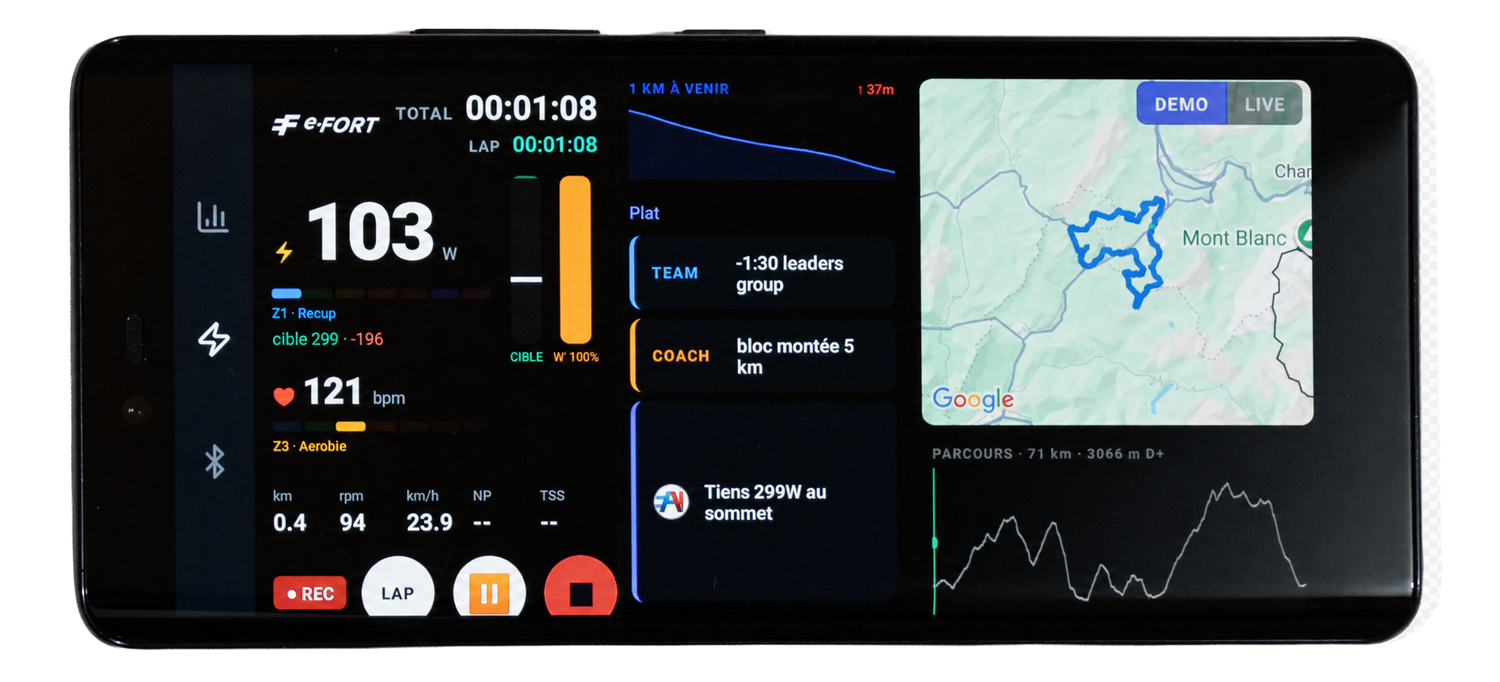
Your phone becomes the bike computer
iOS & Android · exclusive
Not a companion app: a replacement. Mount it on the handlebar and it does the job of a head unit — with the e-FORT models running live, which no head unit does.
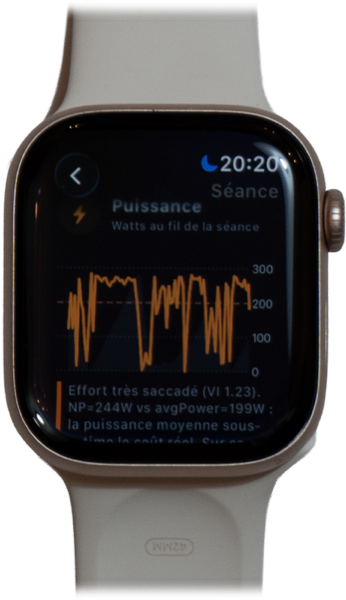
A coach on your wrist
Apple Watch
Daily condition and overnight recovery — and above all a conversation with the AI coach without taking your phone out of your pocket.
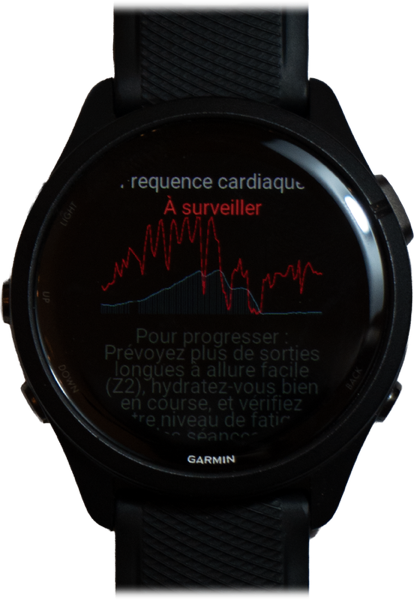
Your Garmin, upgraded
Connect IQ extension
Keep the watch you know. The e-FORT gauges appear on it — no new device, no habit to unlearn.
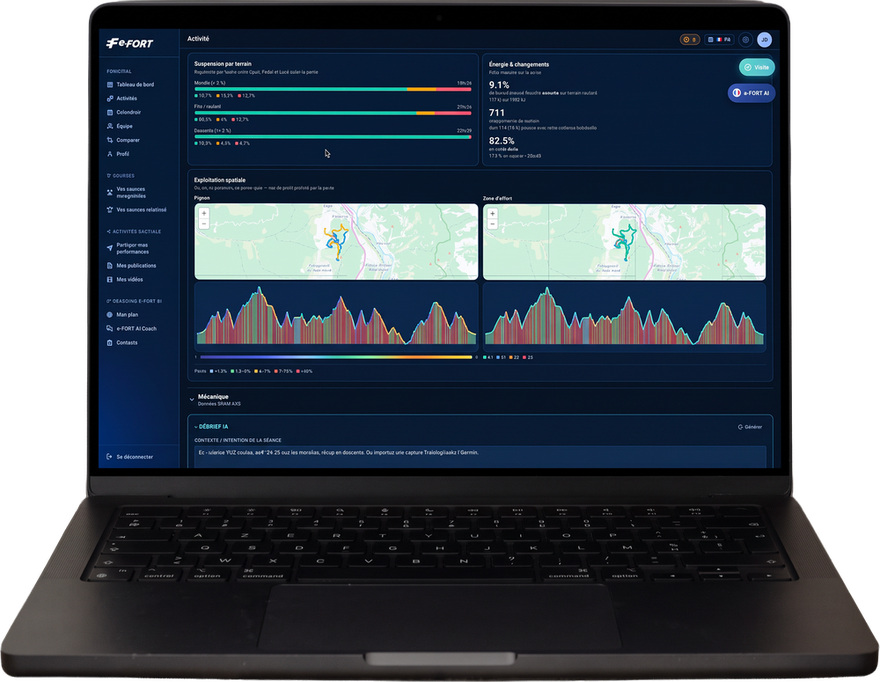
The complete experience: analysis, comparison, race strategy, the 3D course model, and the coach and team environments. This is where the work gets done.
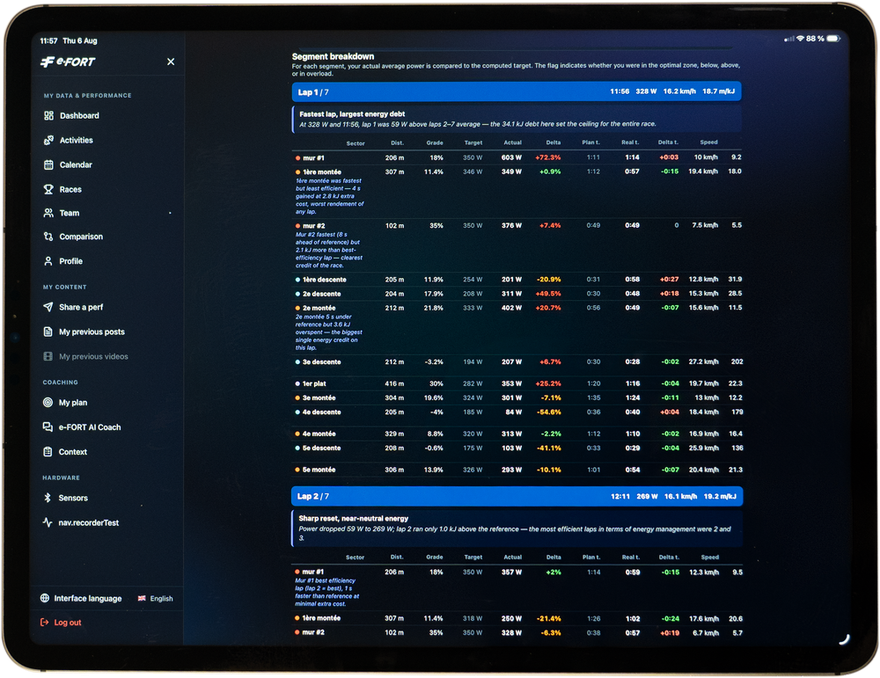
The big screen for the debrief: multi-athlete comparison on synchronised graphs, side by side, right after the race.
Automatic synchronisation with Garmin, Polar, Wahoo and Hammerhead. One click and your entire history is there — no export, no file, no typing. Cycling and running at launch.
